Database vendors like Oracle provide options to create compressed tablespaces to store the data. The perceived value is the reduced storage need. While the storage used can be potentially reduced, there is a possibility of negatively impacting CPU utilization of the database server for the compression related activity on the database server. Modern All Flash Storage arrays offer excellent compression and stores all data natively in compressed format. This study was done to compare performance of virtual machines using database and storage compression
Per Oracle: (http://www.oracle.com/technetwork/database/options/compression/faq-092157.html) The compression ratio achieved in a given environment depends on the data being compressed, specifically the cardinality of the data. In general, organizations can expect to reduce their storage space consumption by a factor of 2x to 4x by using Advanced Row Compression.
Natively Pure Storage achieves similar compression for Oracle data. So the solutions are equivalent in storage savings. We shall compare their impact on other aspects
1.1 The Test Setup:
Contents
- 1 1.1 The Test Setup:
- 2 1.2 Oracle Database Server:
- 3 1.3 The Test:
- 4 1.4 Schema build with the Non-Compressed tablespace:
- 5 1.5 Schema build with the Compressed tablespace:
- 6 1.6 Disk IO statistics:
- 7 1.7 Oracle Database compression Results:
- 8 1.8 Data Reduction ratios for compressed and uncompressed tablespaces volumes:
- 9 1.9 Conclusion:
The tests were conducted in a vSphere 6 cluster attached via ISCSI to a Pure All Flash Array for shared storage. Oracle Enterprise Linux 6.5 was used as the Oracle database platform.
1.2 Oracle Database Server:
Oracle 12c grid infrastructure was setup in a VMware Virtual environment. The Oracle database was hosted on a 4vCPU 32 GB RAM virtual machine running Oracle Enterprise Linux 6.5 with space allocated on a Pure Storage array
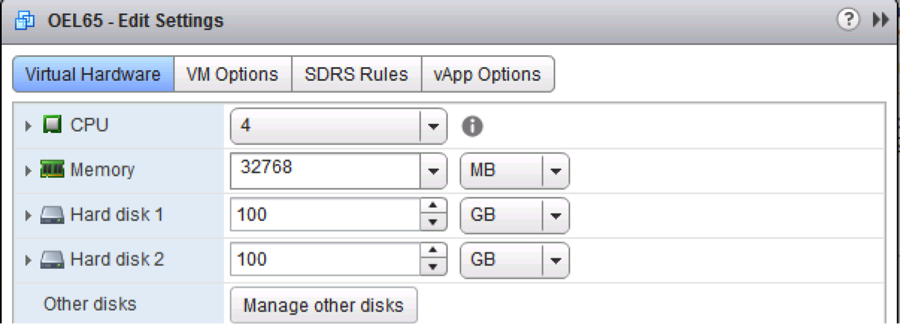
The virtual machine is hosted in a VMware vSphere 6 environment running on Dell POWEREDGE servers.
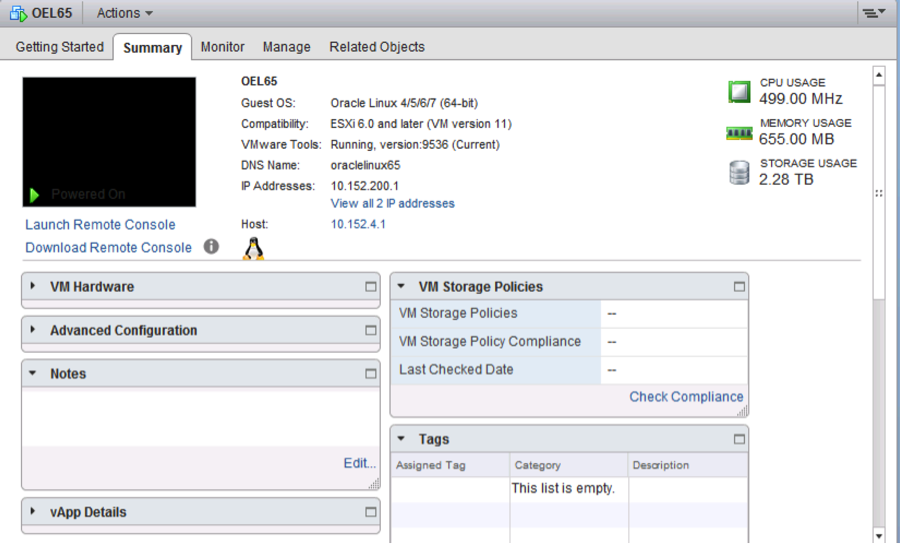
The database virtual machine and its data partitions are stored in a Pure FA-420 array.

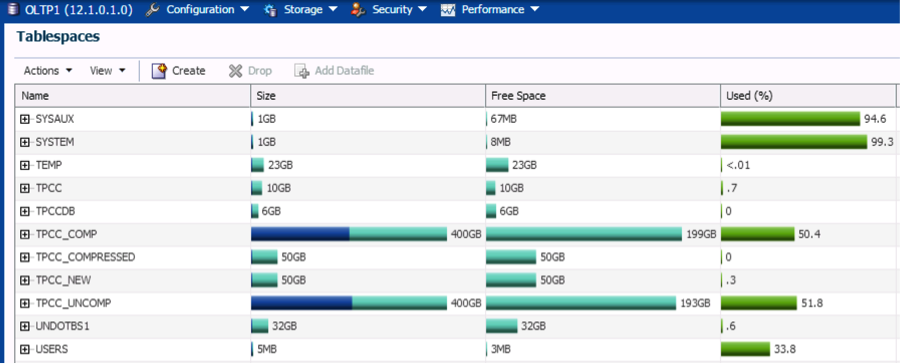
The Oracle database is 12c (version 12.1.0.1.0). The details of the database are shown below:
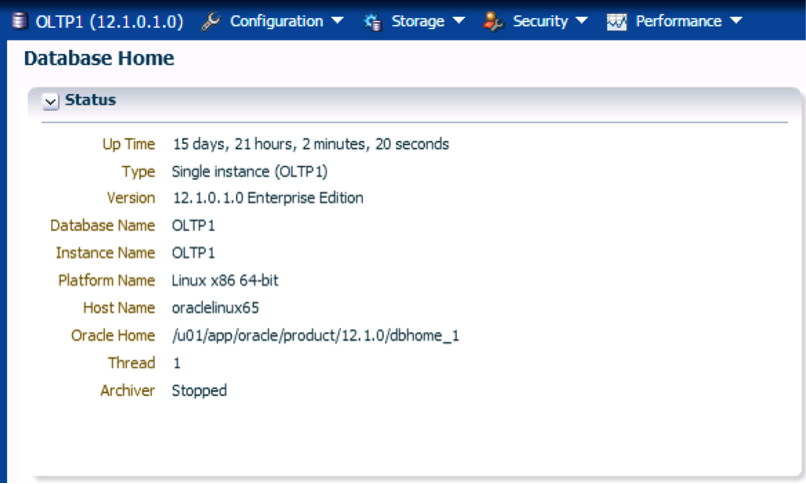
The non-compressed tablespace is TPCC_NEW and the compressed tablespace is TPCC_COMPRESSED for 10GB workload. The physical datastores are managed by Oracle ASM. The TPCC_COMP and TPCC_UNCOMP are used for the 200 GB workload.
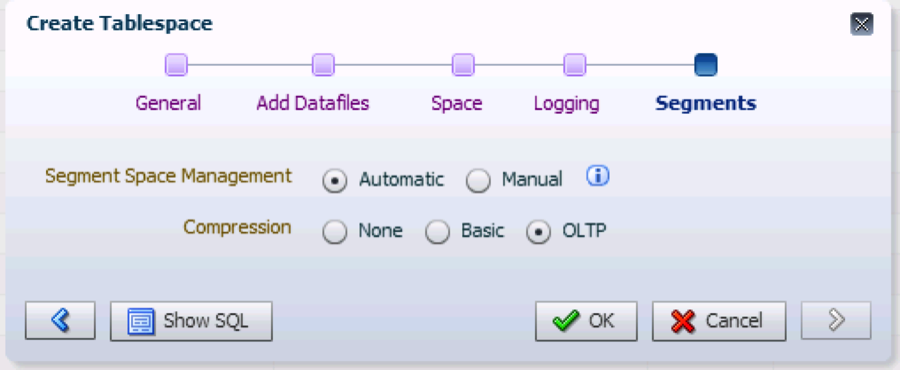
During the creation of the compressed tablespace the OLTP compression was chosen as shown below:
1.3 The Test:
HammerDB is a commonly used tool to profile OLTP and is a TPCC like test. Oracle compression has a special option for OLTP data that we will leverage and test against HammerDB.
Hammerdb has a performance intensive load operation that is used to create OLTP transactional data in the database. We will compare the performance of this database load operation for compressed and non compressed tablespaces.
The test is run from a Linux client with Oracle client for 12c installed in it. The load test was done to simulate a small DB load (10 GB) and a relatively larger DB data load (200 GB). The HammerDB is run from an X-windows session on the Linux client. The Linux client used for the small DB test has 4 vCPU and 16 GB RAM for its configuration and 16 vCPU with 32 GB RAM for the large DB test.
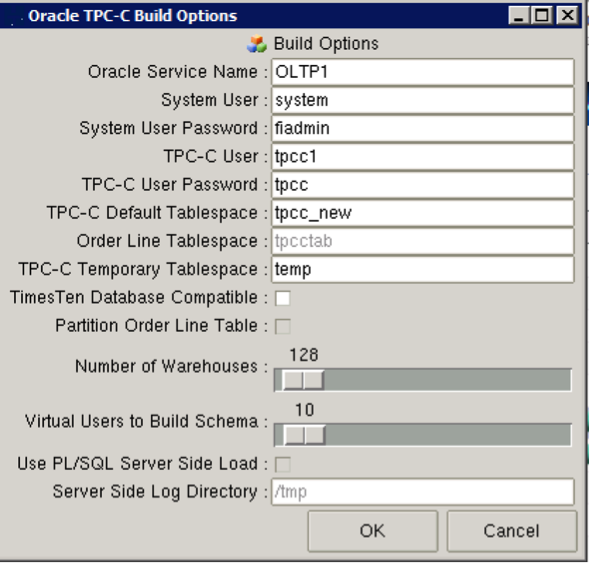
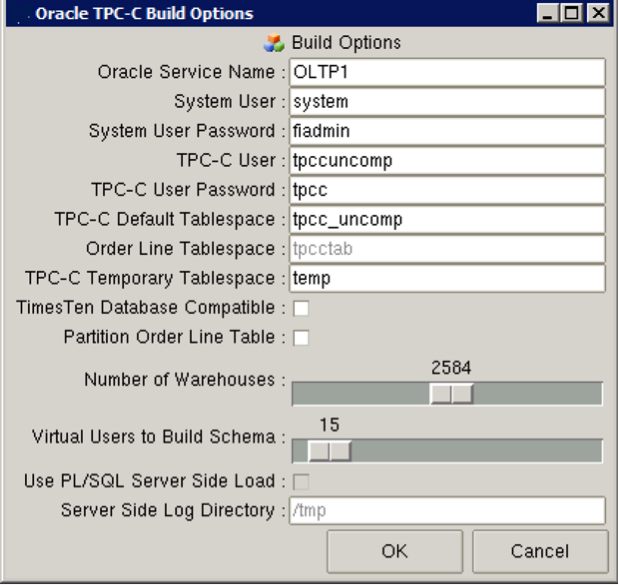
The load test details are shown. The number of users and warehouses were the same for both the scenarios.
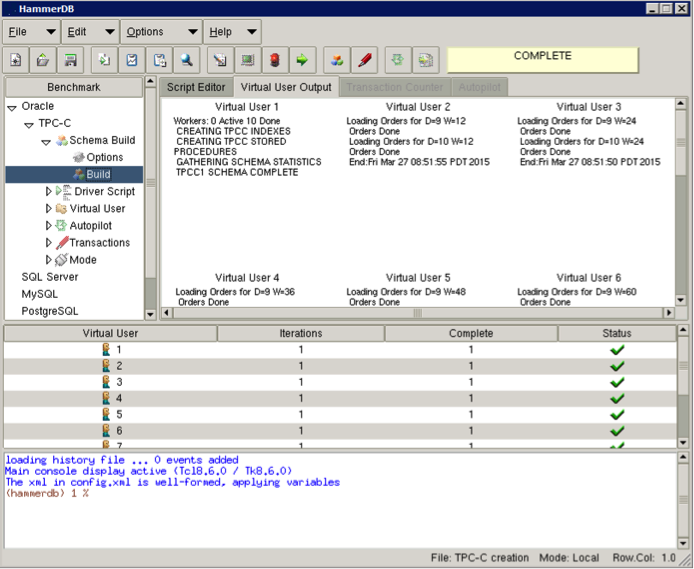
The schema build operation creates all the warehouses using parallel streams represented by the number of users. The schema is created and the data for the warehouses loaded over a period of time.
1.4 Schema build with the Non-Compressed tablespace:
The TPCC schema build tool was pointed to the tablespace TPPC_NEW. This tablespace has no compression enabled. It was ensured that this was the only job running against the database and the storage array. The schema build was then run against this tablespace. The database server performance characteristics were then monitored during the runtime. The performance of the Pure array was also noted.
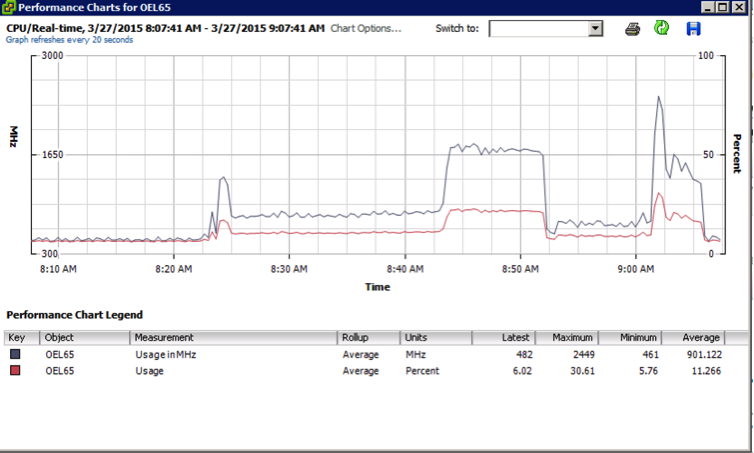
The CPU chart for the database server during the run is shown. There are several phases during the run is shown below:
1.5 Schema build with the Compressed tablespace:
The TPCC schema build tool was pointed to the tablespace TPPC_COMPRESSED. This tablespace has compression enabled. It was ensured that this was the only job running against the database and the storage array. The schema build was then run against this tablespace. The database server performance characteristics were then monitored during the runtime. The performance of the Pure array was also noted.
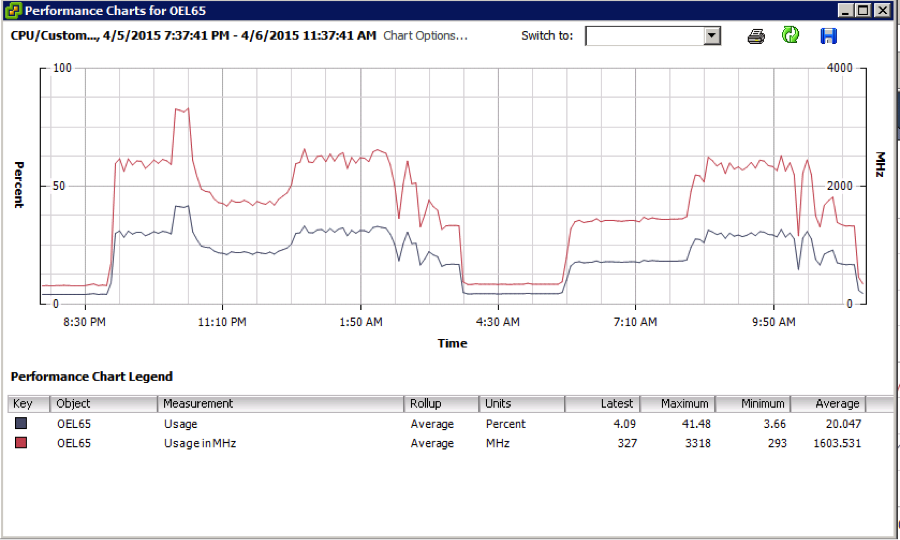
The CPU chart for the database server during the runs are shown.
1.6 Disk IO statistics:
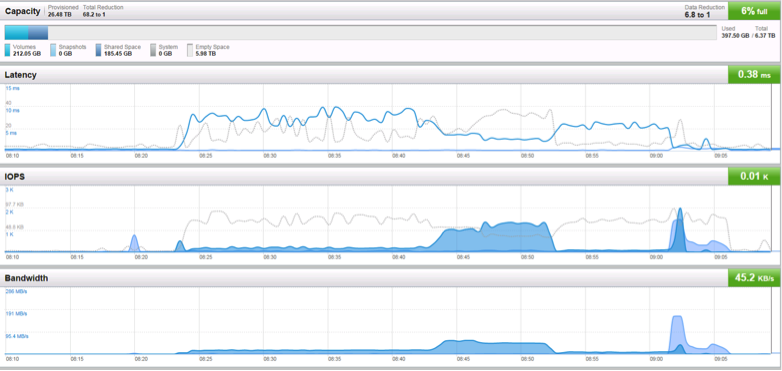
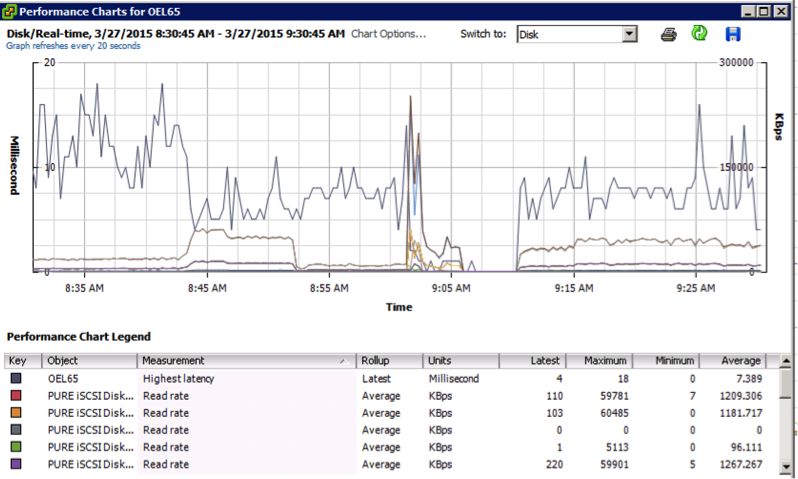
The disk IO statistics during the schema build was observed for both compressed and non compressed tablespaces and no significant impact was noticed.
The array performance and the IO performance of the virtual machine during the test runs are shown below.
1.7 Oracle Database compression Results:
In the idle state the Oracle database server was consuming 550 MHZ on an average. The CPU consumption during the test will need to be normalized by subtracting this idle consumption from the results. The test was repeated to confirm that the results were identical.
The activity during a schema load seems to have to two different phases from a CPU utilization perspective. In the first phase there is a long duration where the CPU load increases and then stays constant for a long time where the majority of the load happens. In the second phase there is a drop in CPU initially and then a short spike when the schema complete and validation happens. So in our analysis we shall look at the results from the first phase where the majority of the activity happens and the entire run.
1.7.1 First Phase Results:
| Phase 1 | Non-Compressed | Compressed | %Difference |
| Avg MHZ (10 GB) | 299.10 | 638.49 | 113.47% |
| Avg MHZ (200 GB) | 1406.45 | 2475.52 | 76.01% |
Table 1: CPU comparison during data load
The first phase results clearly show that the compressed workload consumes more than twice the CPU of the non-compressed workload. This shows that Oracle tablespace compression does significantly impact the CPU utilization of the database server for intensive data load operations.
1.7.2 Full run Results:
| Full Run | Non Compressed | Compressed | %Difference |
| Avg MHZ (10 GB) | 563.81 | 700.45 | 24.23% |
| Avg MHZ (200 GB) | 1753.07 | 2121.49 | 21.02% |
Table 2: CPU comparison during full load test
The full run results also show that the compressed workload consumes more CPU than the non-compressed workload. This shows that Oracle tablespace compression does impact the CPU utilization of the database server for intensive data load operations. The amount of CPU degradation depends on the type of operation.
1.7.3 Full run Duration:
The duration of the load was compared between the compressed and the non compressed tablespaces. This data clearly shows that not only is the CPU utilization more for the compressed data, but the duration of the load is much longer and hence slower as well.
| Time | Non Compressed | Compressed | %Difference |
| Minutes (10 GB) | 38.00 | 46.00 | 21.05% |
| Minutes (200 GB) | 340 | 405 | 16.05% |
Table 3: Comparison of run times during the load
1.8 Data Reduction ratios for compressed and uncompressed tablespaces volumes:
If one compares the compression ratios for the volume storing the compressed and uncompressed tablespaces, there is minimal difference between the two. The total reduction is higher 3.0 to 1 versus 2.9 to 1 for uncompressed tablespace. The data reduction is higher 2.6 to 1 versus 2.5 to 1 for compressed tablespace. There is very little difference in between database and storage compression.


1.9 Conclusion:
The results have clearly shown that the Oracle compression reduces CPU performance of the database server. Oracle compression consumes significant amount of CPU resources and can negatively impact performance of the database workload. So based on the results one can clearly benefit by choosing storage compression over Oracle database compression when using modern all flash array solutions like Pure. By avoiding database compression the CPU resources of the Oracle database server can be used to service more of the actual workloads.

