When optimizing Linux server performance, ‘atop’ is a command every system administrator should have in their toolkit. While many sysadmins are well-acquainted with top and htop, atop stands out as a powerhouse tool for real-time system monitoring and in-depth server analysis.
In this article, we will explore the ‘atop’ Linux command, examine its advantages, and provide a guide on how to utilize its capabilities effectively.
Table of Contents
Advantages of atop
Contents
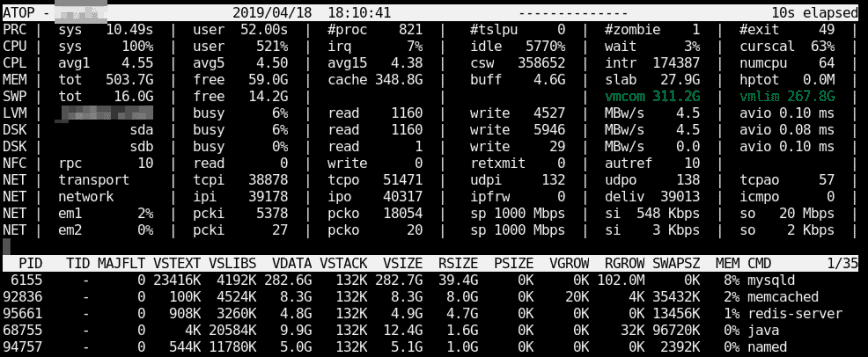
atop is an ASCII full-screen performance monitor that can log and report the activity of all server processes.
One feature I like is that atop will stay active in the background for long-term server analysis (up to 28 days by default).
Other advantages include:
- Shows resource usage of ALL processes, even those that are closed/completed.
- Monitors threads within processes & ignores unused processes.
- Accumulates resource usage for all processes and users with the same name.
- Highlights critical resources using colors (red).
- Will add or remove columns as the size of the display window changes.
- Includes disk I/O and network utilization.
- Uses netatop kernel module to monitor TCP & UDP and network bandwidth.
Once atop is launched, by default, it will show system activity for CPU, memory, swap, disks, and network in 10-second intervals.
In addition, for each process and thread, you can analyze CPU utilization, memory consumption, disk I/O, priority, username, state, and even exit codes.

Install atop on RHEL/CentOS/Fedora Linux
First, install and enable EPEL (Extra Packages for Enterprise Linux) repo. See RedHat solution #308983.
dnf install atop
Install atop on Debian/Ubuntu Linux
apt install atop
Once installed on any distro, you can launch it similarly to top using:
atop
Using atop command – system & process monitor
From tracking average-per-second total values to diving into specific aspects like memory, disk, and scheduling information, ‘atop’ offers a versatile array of options for gaining insights into your Linux server’s performance.
It’s essential to acquaint ourselves with the key commands that unlock atop’s full potential.
Here’s a list of essential ‘atop’ commands:
Launch with average-per-second total values:
atop -1
Launch with active processes only:
atop -a
Launch with command line per process
atop -c
Launch with disk info
atop -d
Launch with memory info
atop -m
Launch with scheduling info
atop -s
Launch with various info (ppid, user, time)
atop -v
Launch with individual threads
atop -y
Don’t forget to read the man pages:
man atop
Once atop is running, press the following shortcut keys to sort processes:
- a – sort in order of most active resource.
- c – revert to sorting by CPU consumption (default).
- d – sort in order of disk activity.
- m – sort in order of memory usage
Additional examples of using the ‘atop’ command for Linux server performance analysis:
- Monitor Specific Processes: You can monitor specific processes with ‘atop’ by specifying their Process IDs (PIDs). For example, to focus on a process with PID 12345, use the command:
atop -p 12345. - Resource Grouping: ‘atop’ allows you to group processes by user, enabling you to see resource usage per user. To do this, press ‘u’ while ‘atop’ is running, and it will display user-based statistics.
- Display Network Activity: To focus on network activity, press ‘n’ in ‘atop.’ This will provide insights into network usage, including which processes are using the network and the data transferred.
- Customize Columns: You can customize the columns displayed in ‘atop’ to suit your needs. Press ‘f’ to access the field selection screen, where you can add or remove columns. For example, you can add the ‘WCHAN’ column to see the waiting channel for each process.
Guide to reading atop reports/logs
By default, after installation, the atop daemon writes snapshots to a compressed log file (eg. /var/log/atop/atop_20140813). To start recording, use: atop -w /path/to/logfile. You can then replay it later using: atop -r /path/to/logfile. This is invaluable for diagnosing intermittent performance issues.
Once you open a log file (e.g., atop -r /var/log/atop/atop_20140813), use t to go forward in 10-minute intervals and T to go back. You can analyze specific times by pressing b then entering the time. The above shortcut keys also work in this mode… a, c, d, m,n.
You can use shortcuts with atopsar. For example, using the flag “-c 30 5” with atopsar will generate a report for current CPU utilization for 5 minutes (ten times with intervals of 30 seconds):
atopsar -c 30 5
Using the flag -A with return all available reports.
atopsar -A
But you can limit this to a specific time window using beginning “-b” and end “-e” flags:
atopsar -A -b 11:00 -e 11:15
As you can see, it’s easy to use atop for Linux server performance analysis effectively.
Other popular command-line tools for Linux server performance analysis:
Conclusion
The ‘atop’ Linux command emerges as a must-have tool for system administrators seeking to maximize server performance. With its real-time monitoring capabilities, process-specific analysis, and customizable features, ‘atop’ empowers you to gain in-depth insights into your Linux servers.
By utilizing advanced ‘atop’ commands like process monitoring, recording and playback, resource grouping, network activity tracking, and custom column configurations, you can proactively identify and address performance bottlenecks.
Incorporating ‘atop’ into your server management arsenal not only enhances your ability to optimize system resources but also ensures your servers run at their best, keeping your digital infrastructure reliable and responsive.


