This post originally appeared on Clouds, etc. by Daniel Paluszek.
At VMware, I get a lot of questions regarding the best way to install vCloud Usage Meter for a successful setup. This post will highlight the key points I’ve learned in my time working with the product. In a future post, I will detail how to use Usage Meter for estimating vRAM / points usage.
This Usage Meter review will be broken out into the following sections – I have split this into three posts.
-
- Key Requirements for Usage Meter
- vCloud Usage Meter Initial Configuration
- vCloud Usage Meter Web Configuration
- vCenter and vROps Setup
- NSX Manager Setup
- vCloud Director Setup
- Verifying and Configuring vCloud Usage Meter Data Collection
- Customer/Rules Setup and Walkthrough
- Monthly Report Walkthrough
- Monthly Report Collection
Key Requirements for Usage Meter
- Ensure the network ports are open! Network/firewall rules are the #1 item that goes awry with a Usage Meter setup.
- Key Port: 443 TCP – this is used for Usage Meter -> vCenter/NSX/vCD/vROps – ensure this is open!
- 8443 TCP is needed inbound to access Usage Meter
- 443 and/or 25 outbound for SMTP emailing is required from Usage Meter
- All ports are in more detail here – vCloud Usage Meter TCP Port Configuration
- Appliance Size: 2vCPU / 3.6GB Memory / 60GB VMDK
- Create a fully qualified domain name and register the IP with your DNS server – just makes things easier.
- Have your service accounts created for the products that need to be monitored.
- vCenter – global read-only access (created at the top level)
- NSX Manager – read-only administrative privileges
- vCloud Director – system admin privileges
- vRealize Automation – read-only administrative privileges
- vROps – automatically discovered
- Create a Network Protocol Profile for the OVF deployment. This is a commonly missed step and barks about no network pools available.
-
- To set this up, browse to your Data Center -> Manage -> Network Protocol Profiles
- Create a new profile (or reuse one) and name it while setting what network(s) Usage Meter will sit on.
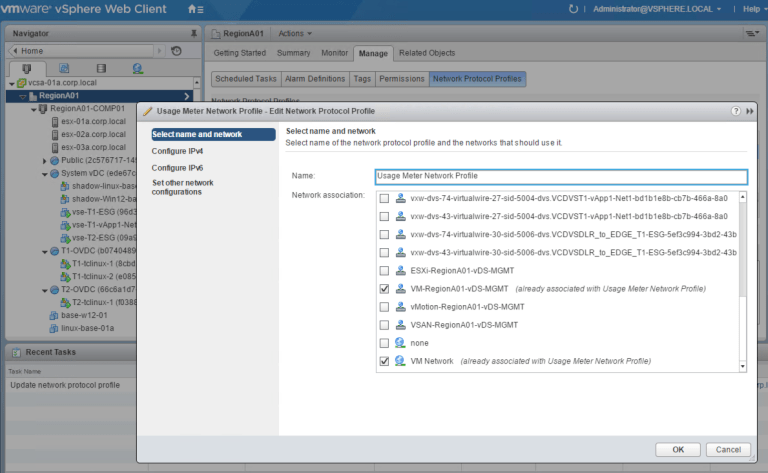
-
- Under Configure IPv4 – set your subnet/CIDR, default gateway, and DNS server. I know this sounds counterintuitive, but you do not need to enable the IP Pool for manual/static configurations. I typically do not bother with IPv6.
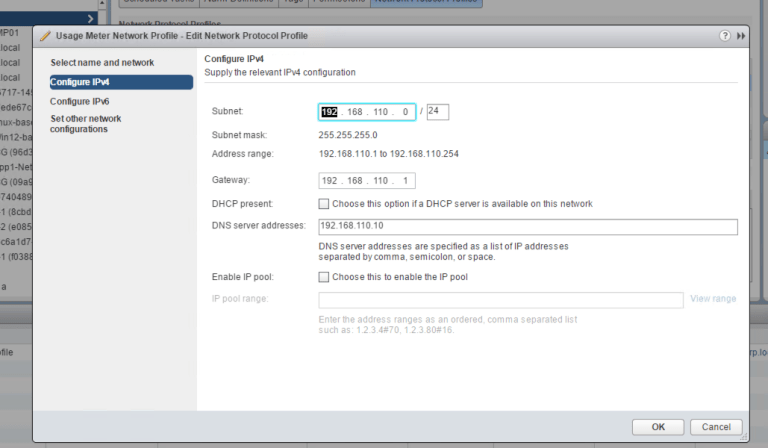
- Under Configure IPv4 – set your subnet/CIDR, default gateway, and DNS server. I know this sounds counterintuitive, but you do not need to enable the IP Pool for manual/static configurations. I typically do not bother with IPv6.
-
- Under Set other network configurations, I usually set the DNS domain and search path.
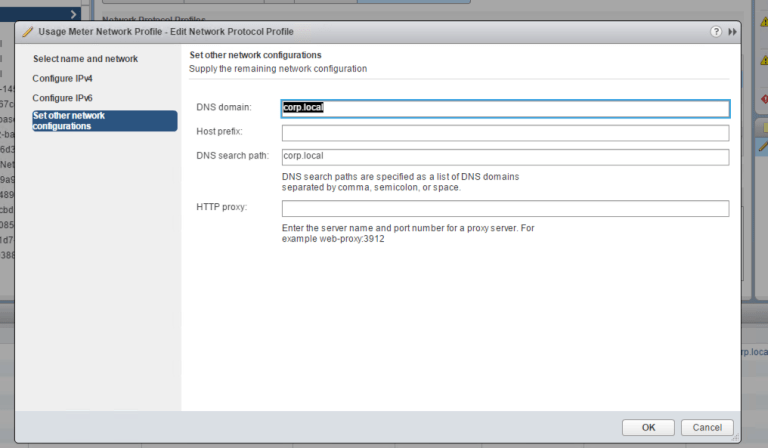
- Under Set other network configurations, I usually set the DNS domain and search path.
-
- Deploy Usage Meter where it’s readily accessible to the monitored environments. For Providers, it usually makes sense to deploy this a management cluster that has access to resource vCenters.
vCloud Usage Meter Deployment Steps
-
- Download vCloud Usage Meter – https://my.vmware.com/en/web/vmware/info/slug/datacenter_cloud_infrastructure/vmware_vcloud_usage_meter/3_6
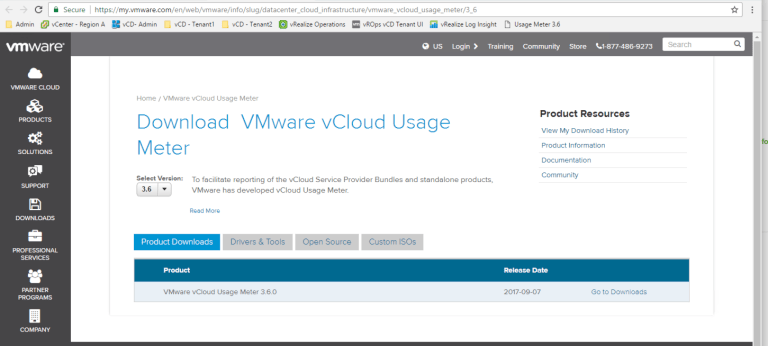
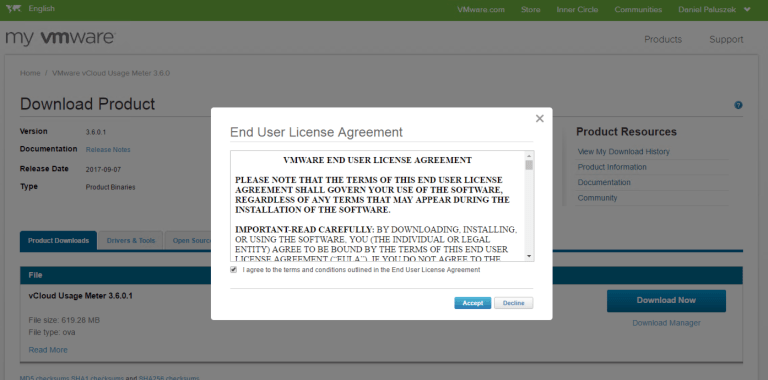
- Download vCloud Usage Meter – https://my.vmware.com/en/web/vmware/info/slug/datacenter_cloud_infrastructure/vmware_vcloud_usage_meter/3_6
-
- OK – before we start to deploy the OVA file, did you remember to establish your Network Protocol Profile???

- OK – before we start to deploy the OVA file, did you remember to establish your Network Protocol Profile???
-
- Let’s go ahead and deploy it to my Management Cluster –
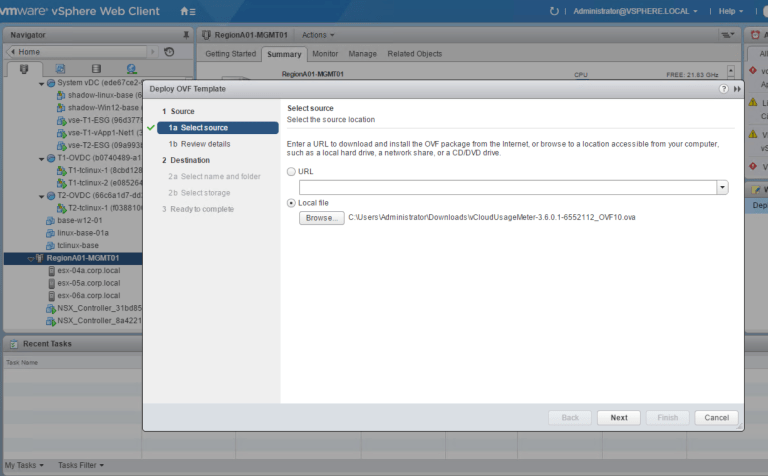
- Let’s go ahead and deploy it to my Management Cluster –
-
- Click Next and ensure we see vCloud Usage Meter 3.6.0.1 –
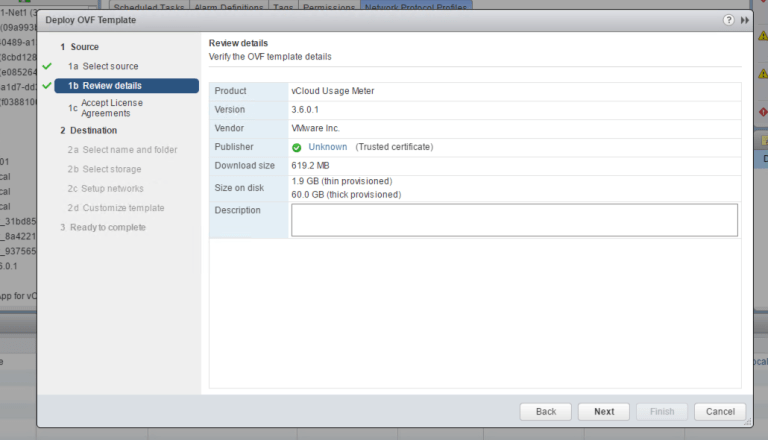
- Click Next and ensure we see vCloud Usage Meter 3.6.0.1 –
-
- Accept the EULA
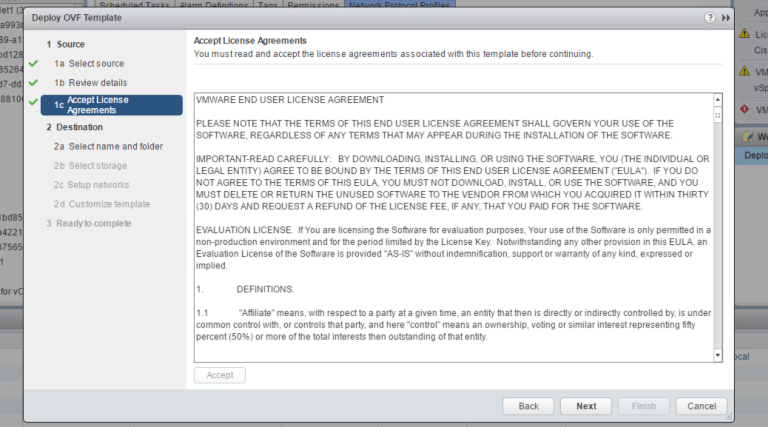
- Accept the EULA
-
- Provide the VM name and folder location
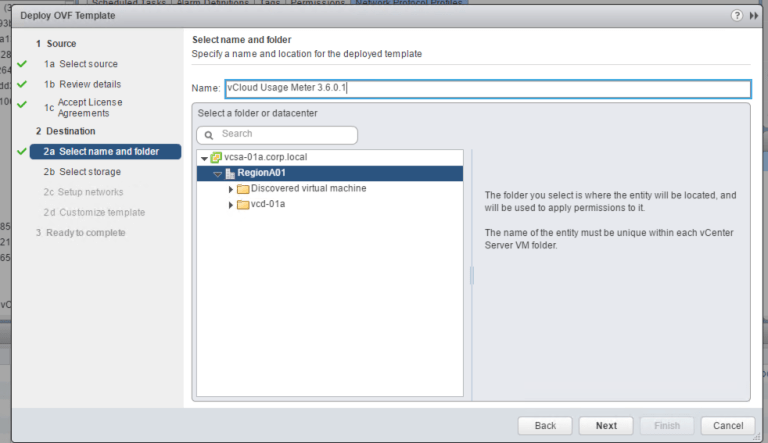
- Provide the VM name and folder location
-
- Select your datastore
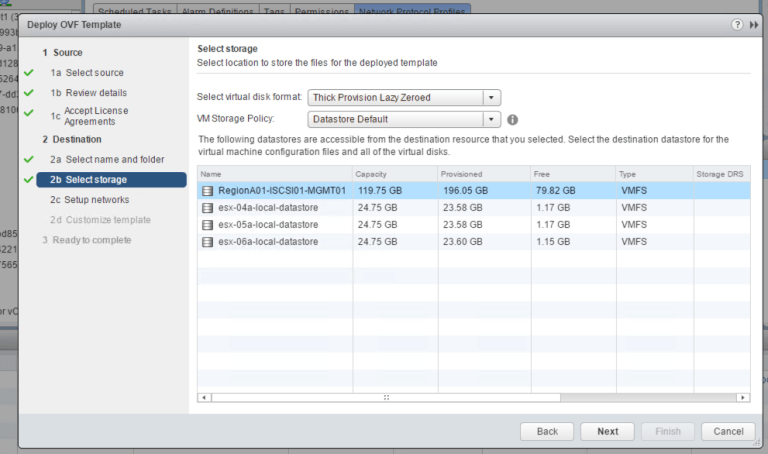
- Select your datastore
-
- Network setup – select the network you put in the Network Protocol Profile and select your IP Allocation method. I typically do static since I have a DNS entry established.
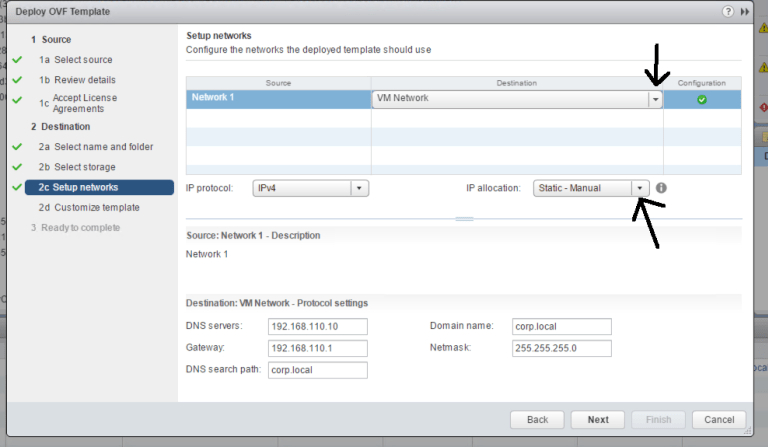
- Network setup – select the network you put in the Network Protocol Profile and select your IP Allocation method. I typically do static since I have a DNS entry established.
-
- The final step for initial deployment – now we need to provide the root and usgmtr passwords along with the IP address of the Usage Meter appliance. Make sure you remember these passwords!
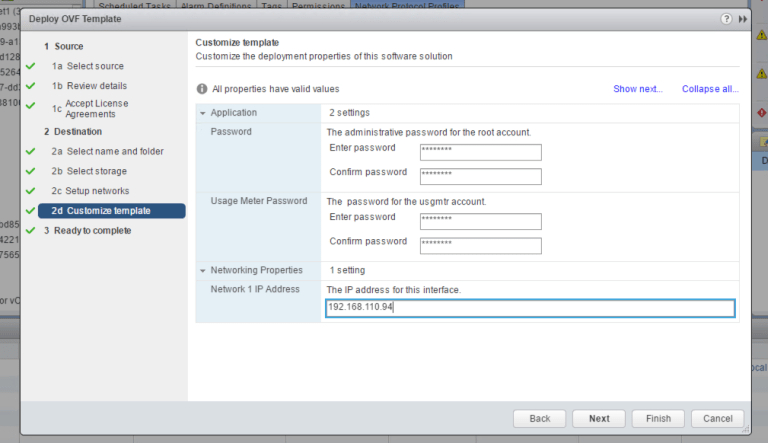
- The final step for initial deployment – now we need to provide the root and usgmtr passwords along with the IP address of the Usage Meter appliance. Make sure you remember these passwords!
- Verify everything looks good and press that Finish button…
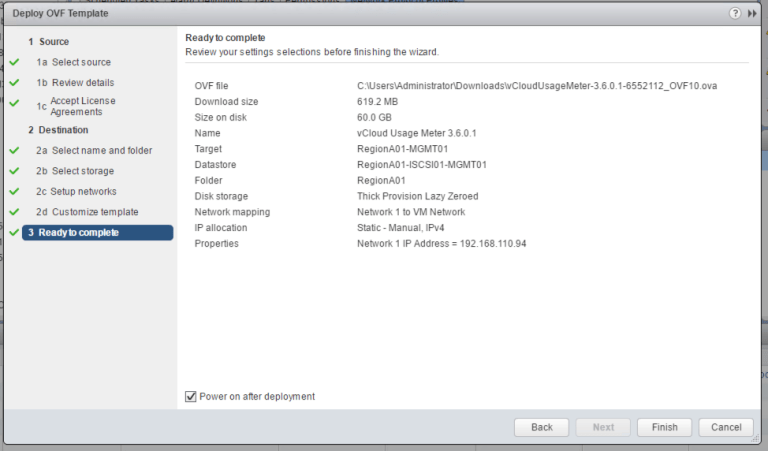
Excellent! Now we should see vCenter deploying and creating the new Usage Meter appliance.
It will take about five minutes for it to fully initialize and start to be available on the network.
vCloud Usage Meter Initial Configuration
-
- Open up the console and ensure the FQDN/IP is available from your workspace.
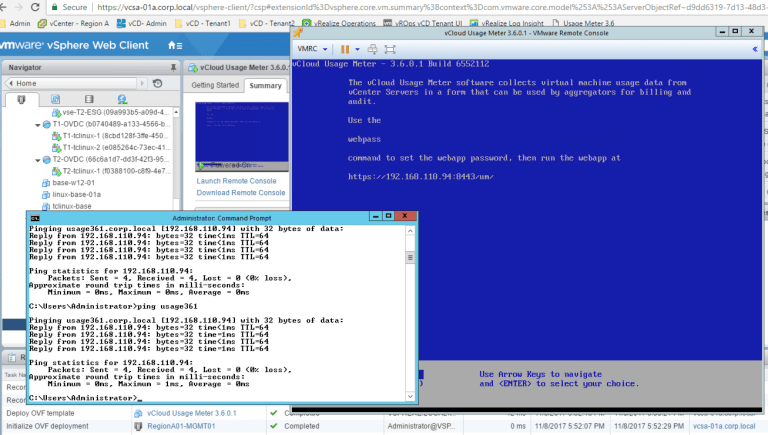
- Open up the console and ensure the FQDN/IP is available from your workspace.
-
- Now let’s hop into the console – we are going to do two things: 1) Set the timezone and 2) set the admin account to log into the web console – this is COMPLETELY separate from the root and usgmtr accounts.
- Setting timezone – click into the console and press the arrow down button to select Set Timezone
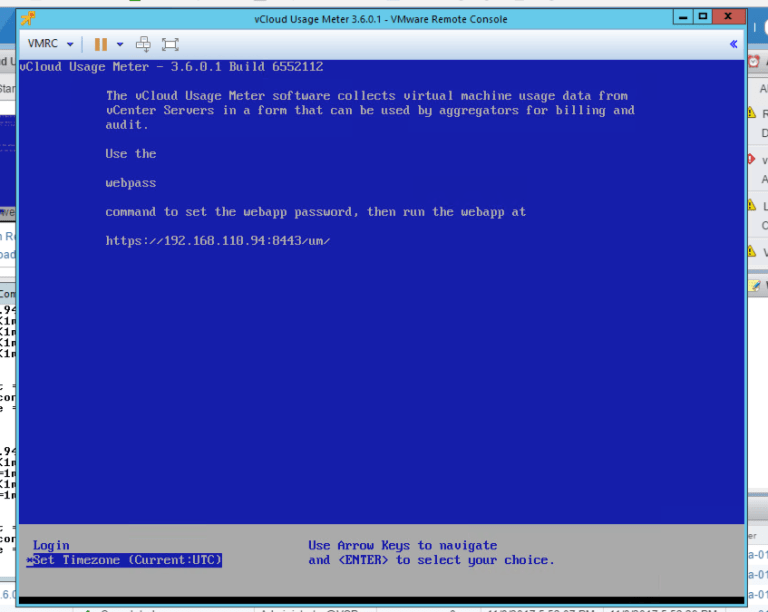
-
- Select your appropriate continent, country, and timezone. Then confirm the changes.
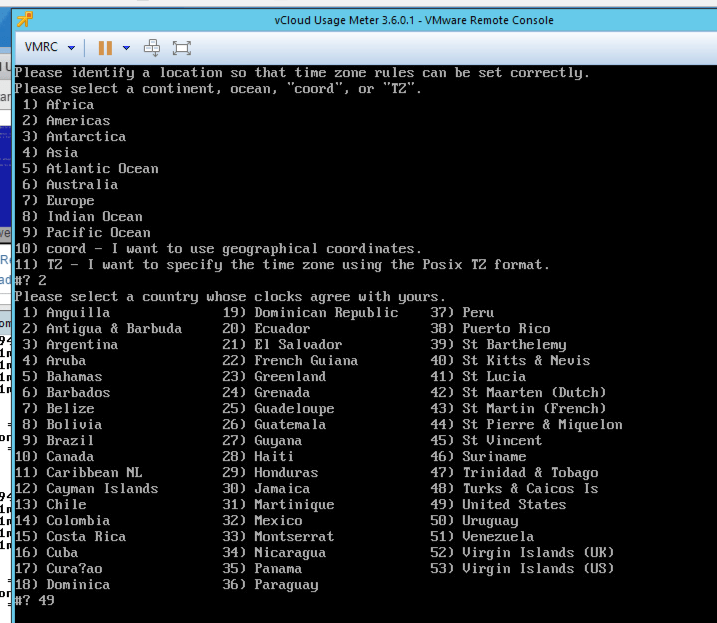
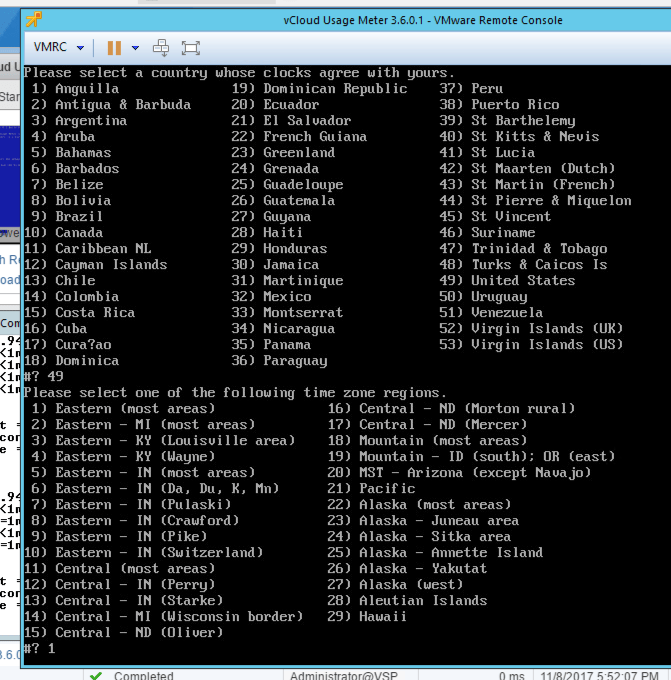
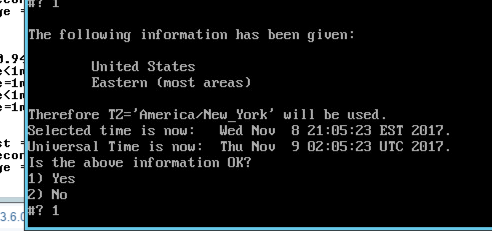
- Select your appropriate continent, country, and timezone. Then confirm the changes.
-
- You will then see a message stating timezone settings have been changed and now back to the blue screen. Let’s now login –
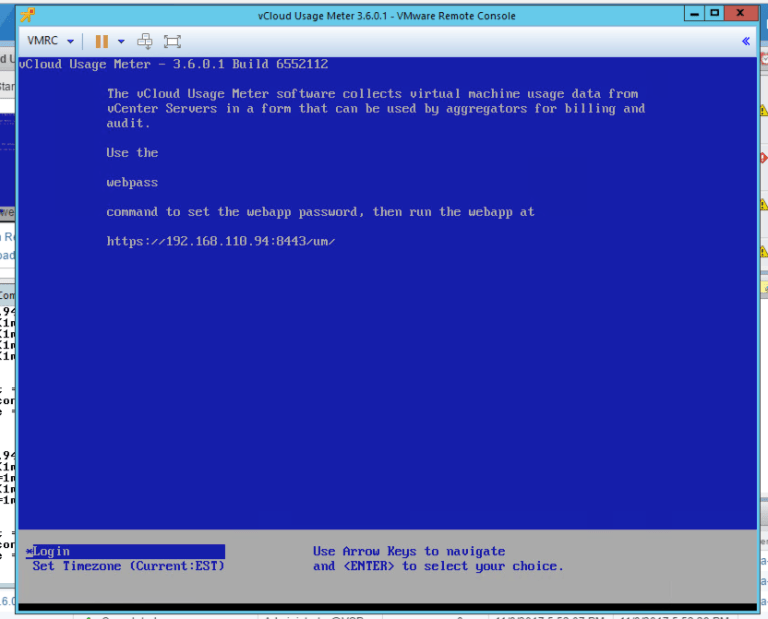
- You will then see a message stating timezone settings have been changed and now back to the blue screen. Let’s now login –
-
- Press enter and type in root and the password that you set at deployment.
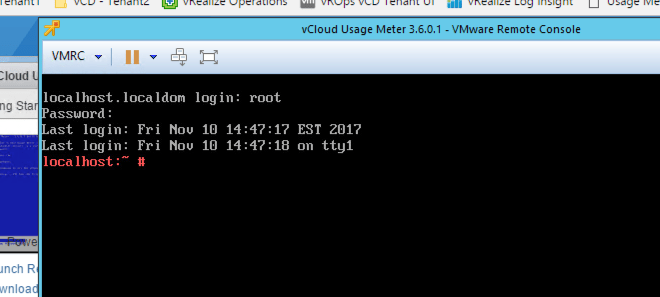
- Press enter and type in root and the password that you set at deployment.
-
- Now type in “webpass” without the quotations. Now type in the password you would like to set for the admin account when we log into the web interface.

- Now type in “webpass” without the quotations. Now type in the password you would like to set for the admin account when we log into the web interface.
-
- OK! One last thing – for some reason, my hostname did not set correctly when deploying. I see localhost when it should be usage361. Let’s use this as a teachable moment when something goes awry on the network side.
-
- Type in “/opt/vmware/share/vami/vami_config_net” – this is a script we use for Usage Meter network changes to this appliance. From here, you can update the IP address, hostname, DNS, etc. DO NOT use traditional Linux commands to update network values – use this script as this updates both the system and Tomcat configurations.
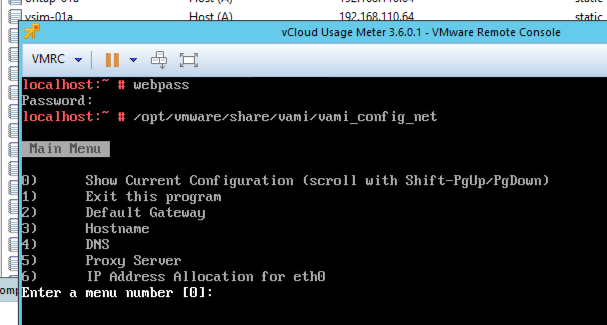
- Type in “/opt/vmware/share/vami/vami_config_net” – this is a script we use for Usage Meter network changes to this appliance. From here, you can update the IP address, hostname, DNS, etc. DO NOT use traditional Linux commands to update network values – use this script as this updates both the system and Tomcat configurations.
-
- Alright, selecting choice 3 and typing in the correct FQDN. For a hostname change, this does require a reboot – so I’m going to press 1 to exit and reboot Usage Meter.
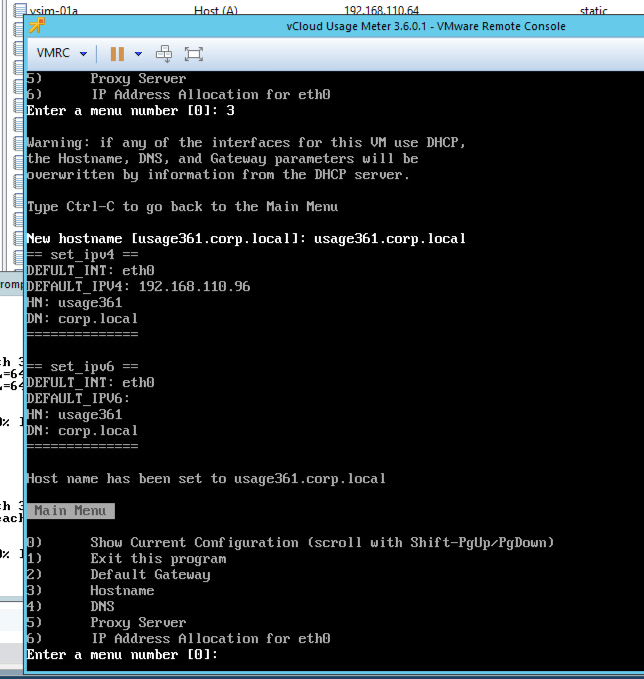
- Alright, selecting choice 3 and typing in the correct FQDN. For a hostname change, this does require a reboot – so I’m going to press 1 to exit and reboot Usage Meter.
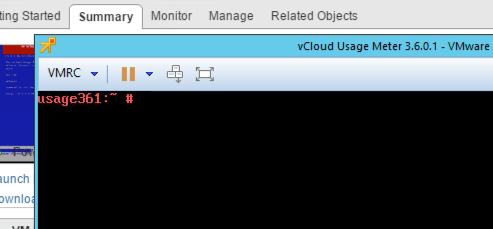
- After the reboot, my hostname is correct.
Stay tuned for the second post in this series!
Stay tuned to the VMware Cloud Provider Blog for future updates, and be sure to follow @VMwareCloudPrvdon Twitter and ‘like’ us on Facebook.

