This blog originally appeared on VirtualNic, by Nic ODonovan.
Recently, VMware released vRealize Operations Manager (vROPs) version 6.6. This release was another big step forward for vROPs, especially with the implementation of the HTML5 portal, along with several other enhancements, like the new dashboard layout. Take a look at the release notes here.
In this post, I am going to talk about how the Blue Medora Management Packs enhance vROPs. I encourage you to familiarize yourself with vROPs before going through this post, we have some great walkthrough videos you can view here.
First, what is vROPs? At a high level, vROPs gives you a single pane of glass so you can securely view your entire VMware virtual environment without having to access vCenter, this keeps the environment secure. vROPs logins are all Role Based and can be set to the object. But that is not all, vROPs comes with a host of other features I will be talking about in this post:
-
- Predictive analytics – identify problems in the environment before they affect users.
- Root cause analysis – pinpoint and remediate any issues.
- Capacity planning – right-sizing the environment.
- Compliance – Compliance checks to ensure your environment is in compliance.
All these features are part of the base functionality of vROPs. Where vROPs get’s even more interesting is when we start talking about adding Management Packs (MPs). A Management Pack is an adapter which plugs into vROPs and connects vROPs to a number of objects in an environment like an application, a database, a server, a storage device down to see the performance on a specific LUN, or even a network device. What this means is, I get all of the base features vROPs provides but now I can extend it past my VMware virtual environment and I can get predictive analytics on a database to see errors before it affects the user, or see what is happening at a network hardware layer without accessing that device. The best part is this is all agentless, no agents are used or installed.
vROPs takes monitoring an environment to a new level, where traditionally I would get an alert for a CPU running high. vROPs actually learns the environment and automatically identifies the performance threshold specific to that machine, or application, or piece of hardware. Say for instance I have a VM that runs a backup job every day at 2am and the CPU maxes out during this time. vROPs will identify this and ensure no false alerts are flagged. This way, if I get an alert, I know it is something I need to pay attention to.
From a Cloud Service Provider (CSP) standpoint, this should be music to your ears, because you provide intelligent monitoring to your customers through a single pane of glass with a single set of credentials and you keep those base environments secure, thereby protecting the integrity of your Cloud offering. CSPs: the other point to note is as a CSP you can consume Blue Medora MPs using your VCPP Points.
Where do we get Management Packs?
-
- The base install of vROPs will provide you with the essential VMware MPs.
- Certain vendors have written their own MPs.
- VMware Marketplace has a number of available MPs here.
Blue Medora (which is the focus of this post) provides the most comprehensive and holistic environment view when it comes to Management Packs. You can view all of their available MPs here. Blue Medora frequently add more MPs to their offering. At the time of this writing, the following is available from Blue Medora:
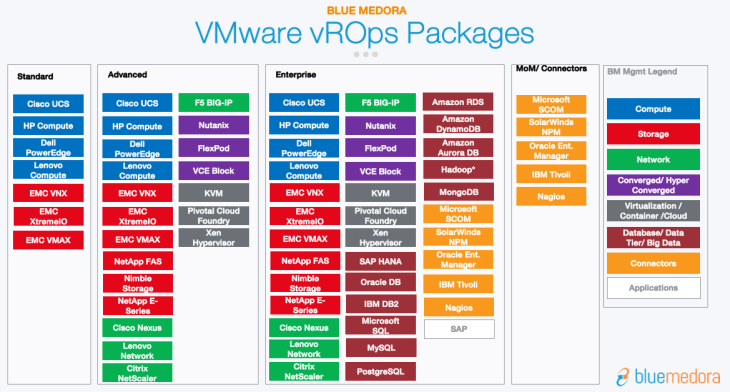
For this post, I am going to focus on a few things, FlexPod, SQL and VMware Management Packs.
Blue Medora FlexPod Overview
As you are already familiar with the vROPs console. Let’s start off by looking at the Objects. In this case, I have selected one of the Cisco UCS Blades. The first thing that catches my attention is the alerts being displayed. I have one alert I need to look at immediately. I can see by reading this alert this environment is missing a local disk.
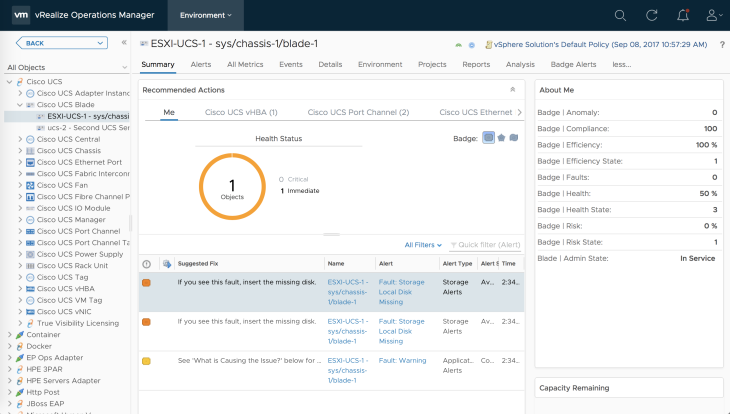
I click on the Alert and I see the symptoms of the alert as well the recommendation to fix this alert, in this to insert the missing disk. This is one of my favorite things about vROPs.

Looking at the All Metrics tab, I can build a custom dashboard based on any metric available to this blade. In this example, I have chosen a dashboard showing me Total Memory, and CPU Temp.

SQL Server Blue Medora MP
Let’s look at a Microsoft SQL Server Database using the Blue Medora MP. I have the same options where I can view my alerts on the Database and see if there is anything I need to pay attention to. Under the Metrics tab, there are several options here to build a dashboard. In this example, we are looking at CPU Usage % for this DB and Number of Locks / Lock Requests per second.
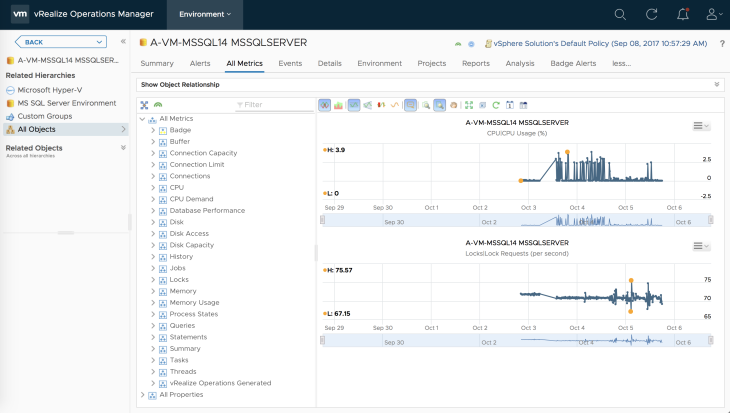
SQL Reporting
Reporting is another powerful feature which can be used across the environment. As you will see in this example, I can generate reports on this specific SQL DB, I can also create my own reports, and export all these reports to PDF. These reports can also be automated, which is a value add for CSP customers.
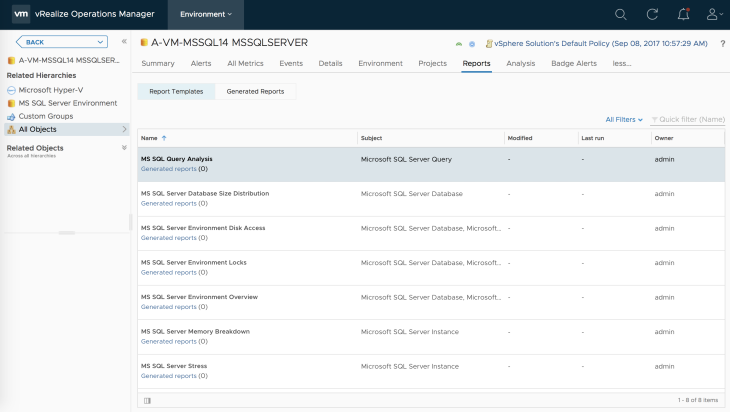
SQL Analysis
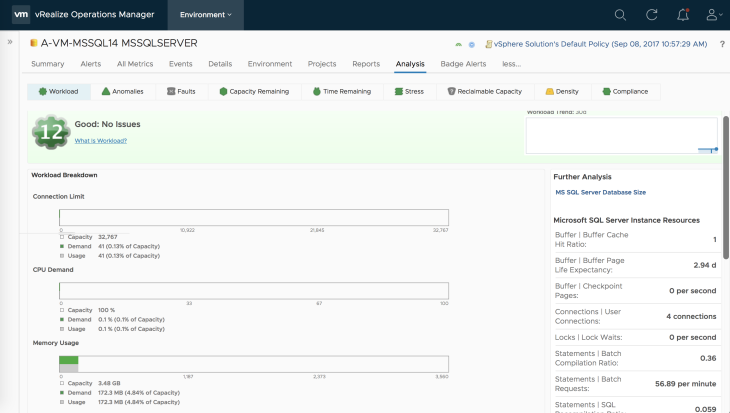
I can also look at an analysis of the environment. In this example, we are looking at the Workload of the Database. The badge shows as Green and 12, which means this database is running smoothly. We know there is no current or future issue here.
Capacity and Time Remaining
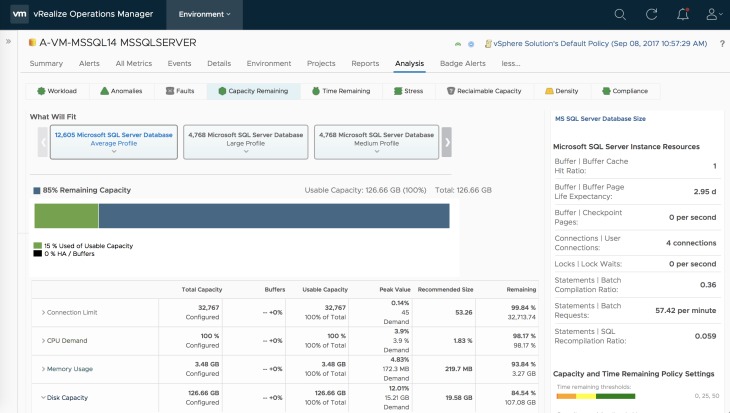
Another feature is Capacity Remaining and Time Remaining, again, this is a feature available to any object within vROPs. Here we see how much capacity we have remaining.
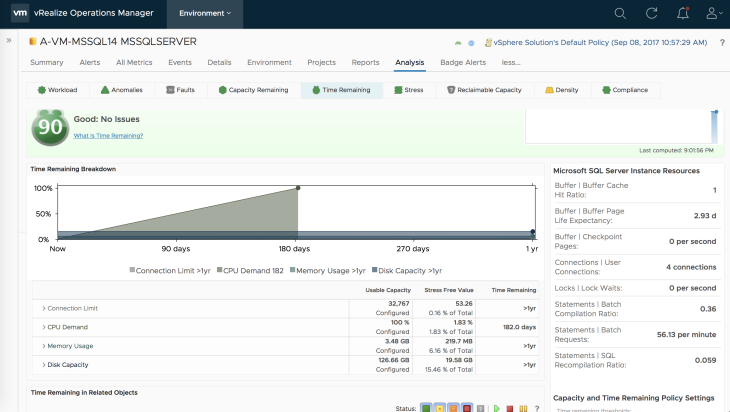
From a time remaining standpoint we see that based on past growth, we have about 180 days until we run out of CPU space on this server, and more than a years worth of hard disk capacity.
VMware vSphere Views
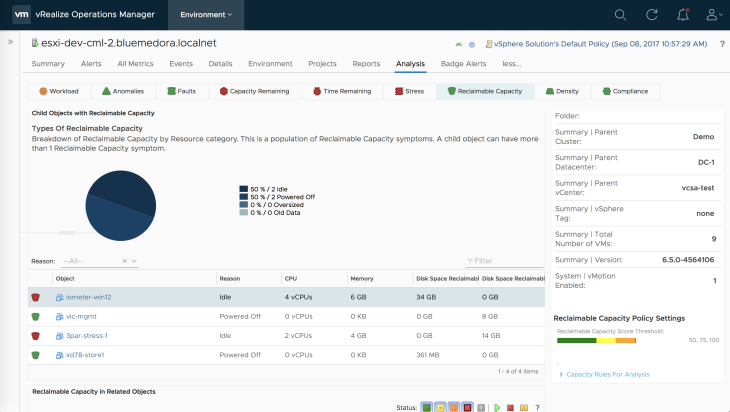
Let’s switch gears and analyze the VMware environment showing how much reclaimable capacity is available. In this example, I can see I have some CPU, Memory, and Storage I can reclaim. Remember, vROPs knows how much CPU, Memory, Disk a VM needs
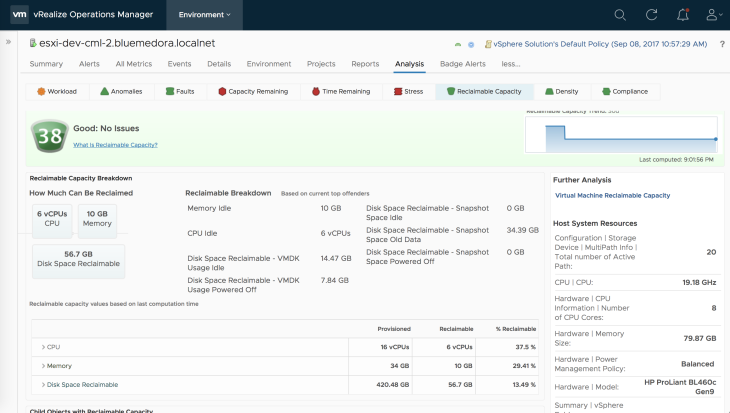
I can also see which specific objects are over or undersized.
Compliance
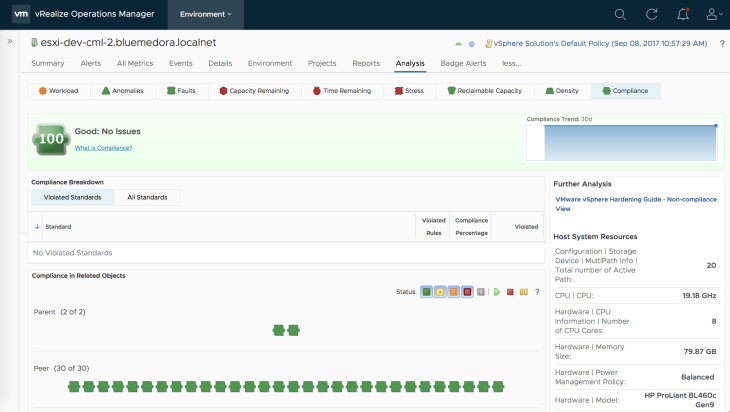
Compliance is where we see whether this ESXi host is in compliance in relation to the VMware vSphere Hardening Guide.
Conclusion
This concludes this post. As you can see, Blue Medora adds so much to an already powerful tool in vROPs.
Stay tuned to the VMware Cloud Provider Blog for future updates, and be sure to follow @VMwareCloudPrvd on Twitter and ‘like’ us on Facebook.

