When it comes to monitoring system resources on Linux, htop has been the go-to tool for many administrators and developers alike. Its simple interface and real-time metrics have made it a staple in the toolkit of those who prefer a comprehensive overview of their system’s performance.
You might already know about htop, a great tool for monitoring resource usage on your computer, but it is not the only one out there. In this post, we will show you the best 9 htop alternatives for Linux (including Ubuntu and CentOS), Mac and Windows in 2024.
Let’s get started!
What is htop?
Contents
htop is an interactive system-monitoring tool for Unix systems, including Linux. It provides real-time insights into system performance, allowing users to view and manage system processes more efficiently than with the traditional top command. htop displays system metrics such as CPU, memory, swap usage, and process information in a user-friendly, color-coded interface. Users can interact with the tool to perform tasks such as killing processes, renicing tasks, and sorting processes by various criteria.
Unlike the standard top command, htop offers a more dynamic and user-friendly experience. It supports vertical and horizontal scrolling, making it easier to view all processes running on the system, and includes features such as searching for processes, tree view for process hierarchy, and customizable display options. htop is highly customizable and can be configured to suit individual preferences and needs.
Suggested read: How to Copy Files in Linux and Overwrite without Confirmation
3 Best htop Alternatives for Linux
While htop is a powerful tool, there are several alternatives that provide additional features and cater to different use cases. Here are three of the best htop alternatives for Linux:
Glance
Glance is a cross-platform monitoring tool that provides a unified view of system metrics. It is designed to be simple yet comprehensive, displaying essential information about CPU, memory, disk I/O, network interfaces, and processes. Glance is easy to use and provides a web-based interface for remote monitoring.
How to Install Glance
To install Glance, follow these steps:
- Install Glance: You can use the apt package manager to install Glance on your Linux computer by using the following command:
sudo apt install glances- Run Glance: After installing the glance, you can start it by executing the following command:
glances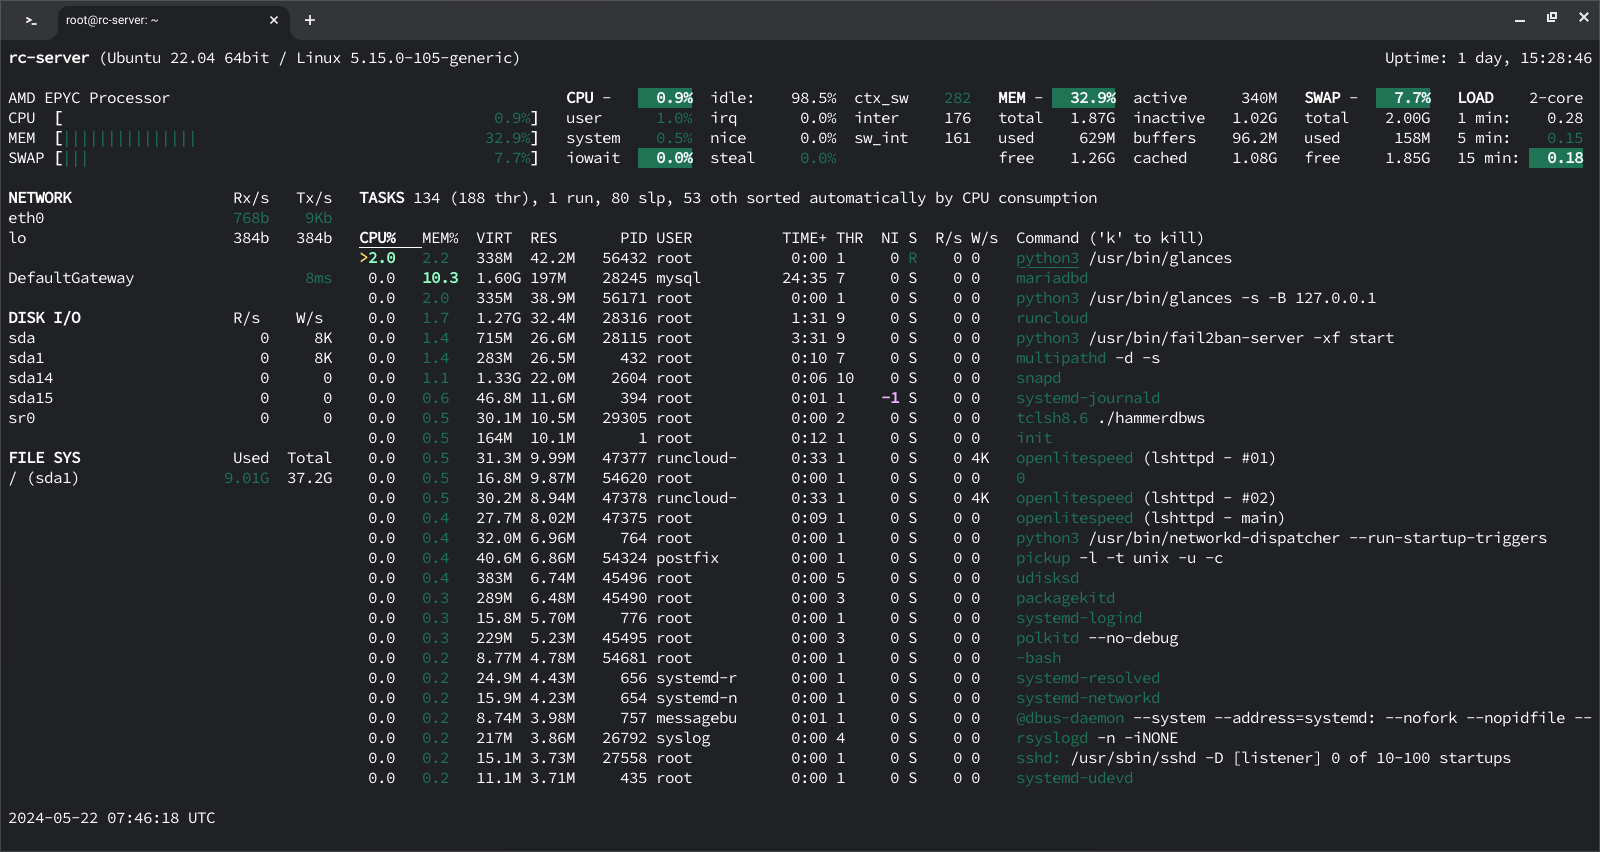
In the above example, we can see how the Glances displays an overview of the system resources in the terminal over an SSH connection.
- Web Interface (Optional): If you want to access the same information over a web interface, then you can start the Glance with the -w parameter, this will start a web server where you can see your resource usage.
glances -w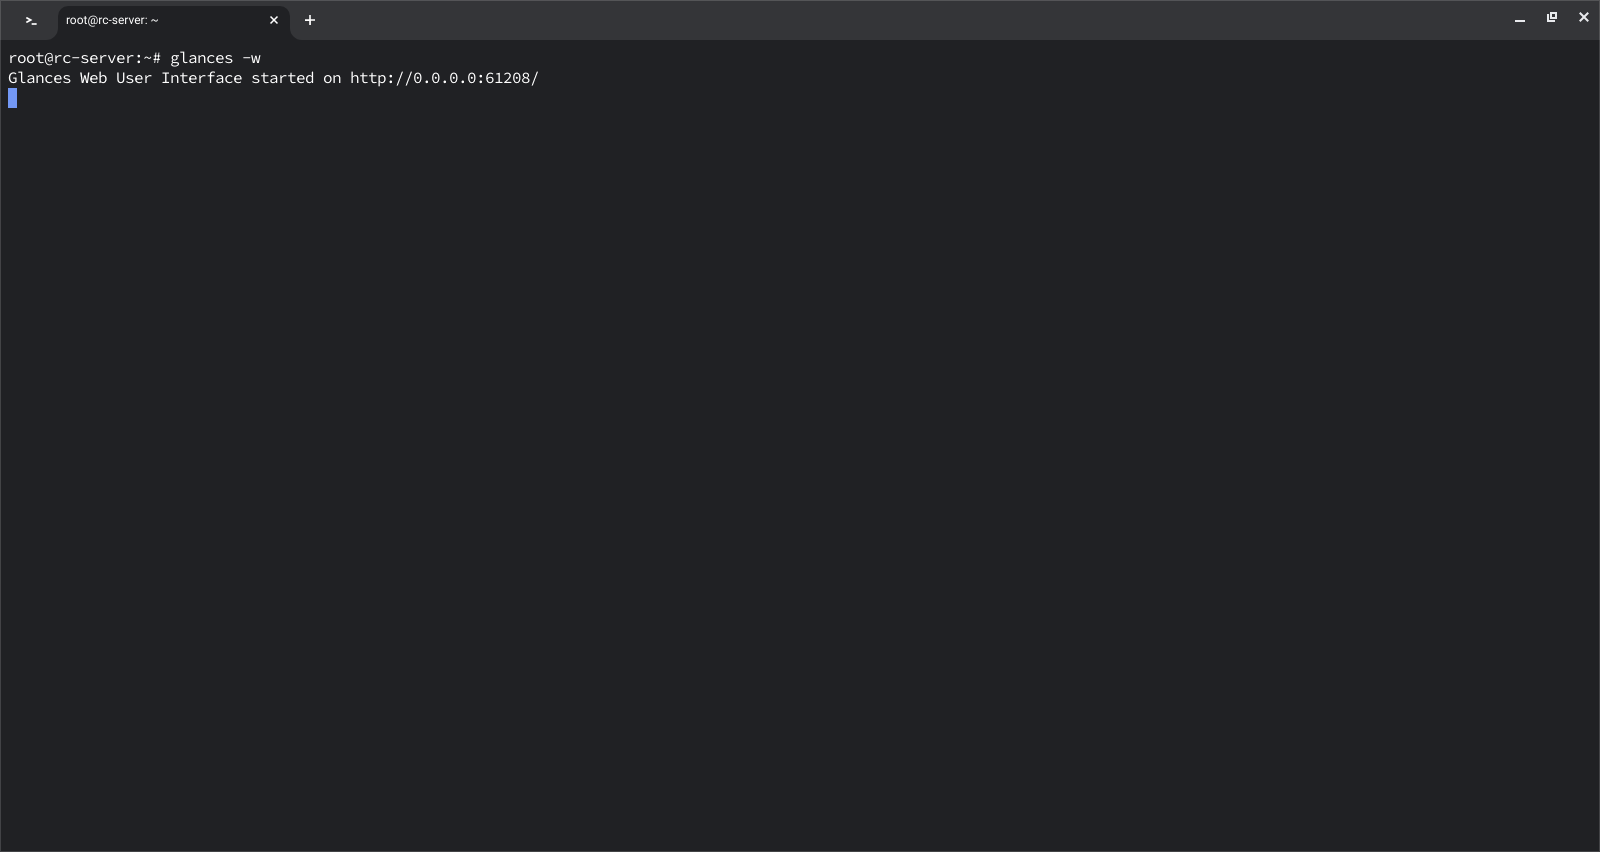
In the above example, we can see that the server was started on localhost but if you are using a VPS then you will need to configure your firewall settings to view this interface. Fortunately, this is very simple using the RunCloud dashboard. Just go to the Security tab of your server and add a new rule to open your desired port.
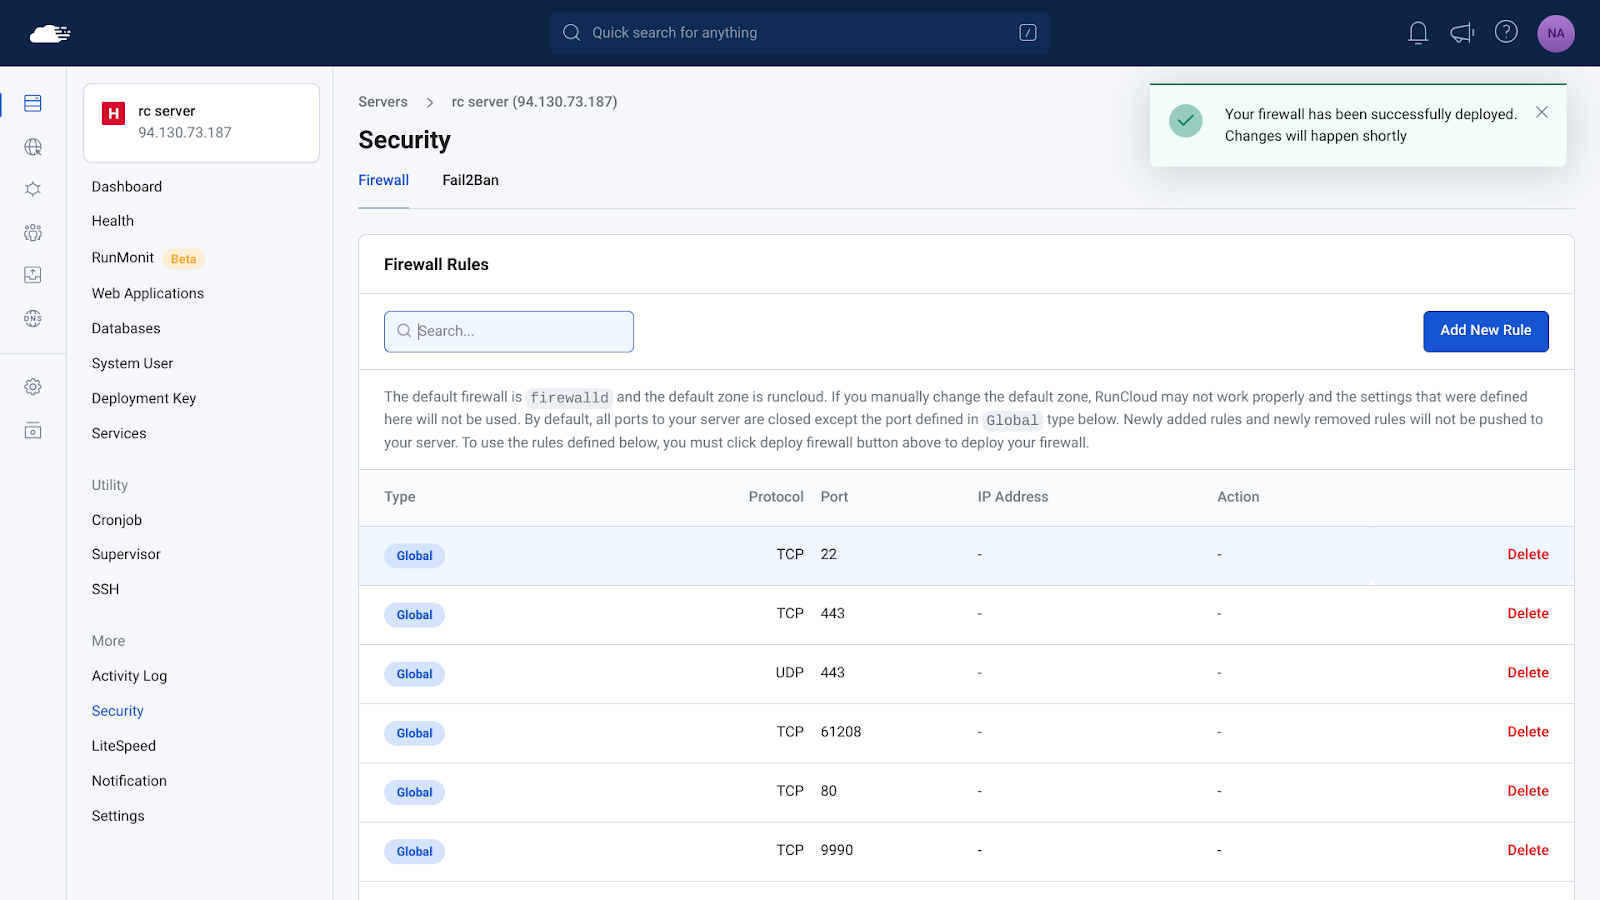
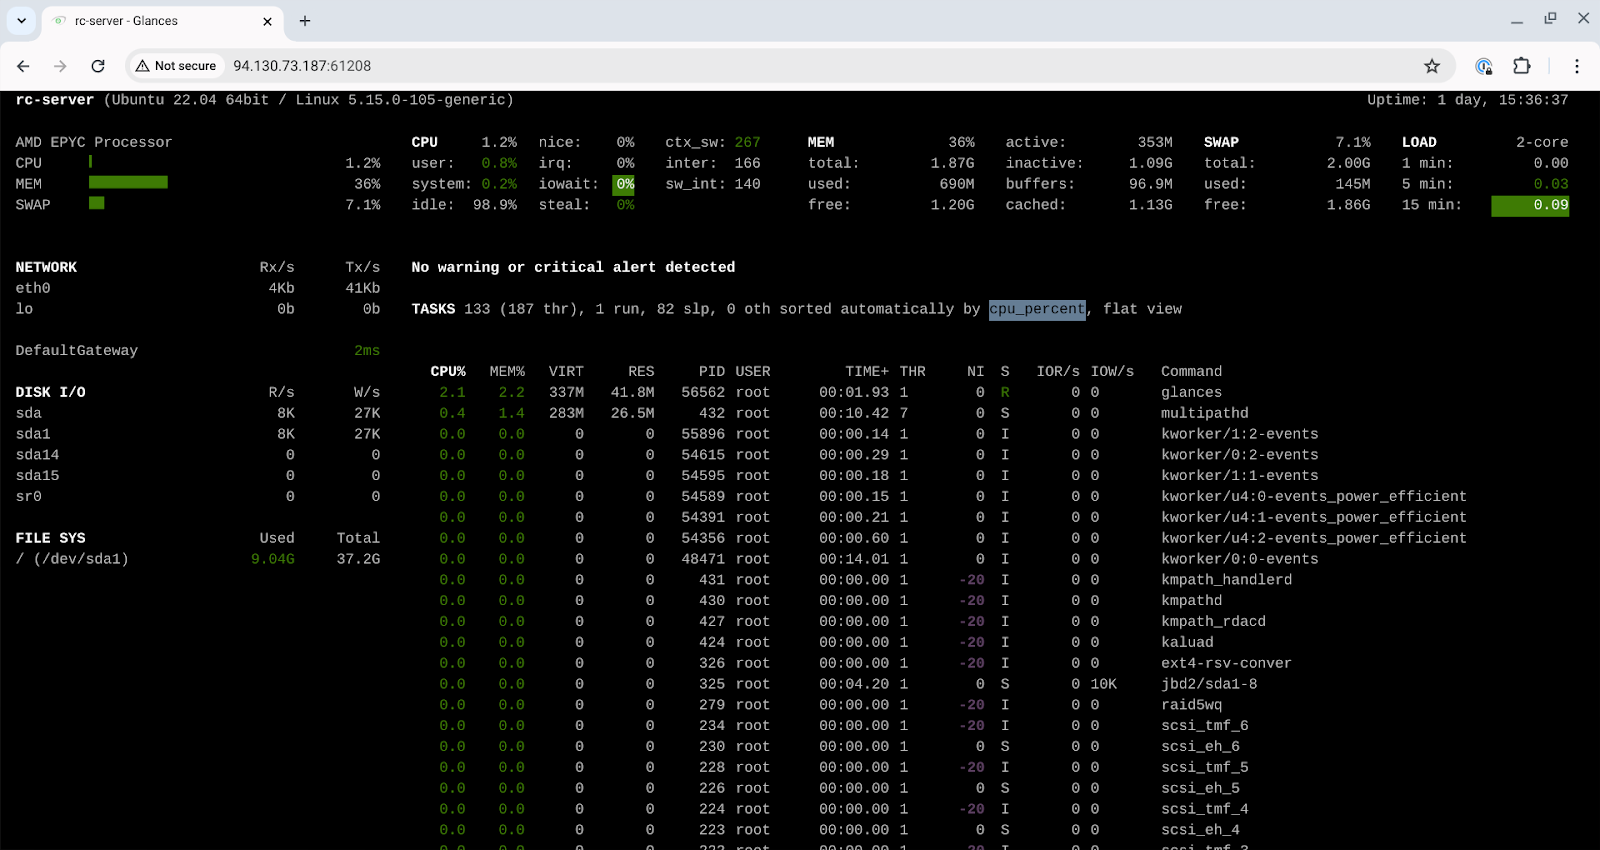
In the above example, the Glances daemon was running on port 61208, once you have configured your firewall, you can access the same dashboard in your web browser by entering the IP address of your server followed by : symbol and the port number as shown below.
Suggested read: Mastering the Echo Command in Linux (with Practical Examples)
atop
atop is an advanced system and process monitor that provides detailed information about system resources. It is particularly useful for performance analysis and troubleshooting as it logs system activity and can show resource usage by individual processes over time. On Ubuntu, you can install and run atop with the following command:
sudo apt-get install atop
sudo atop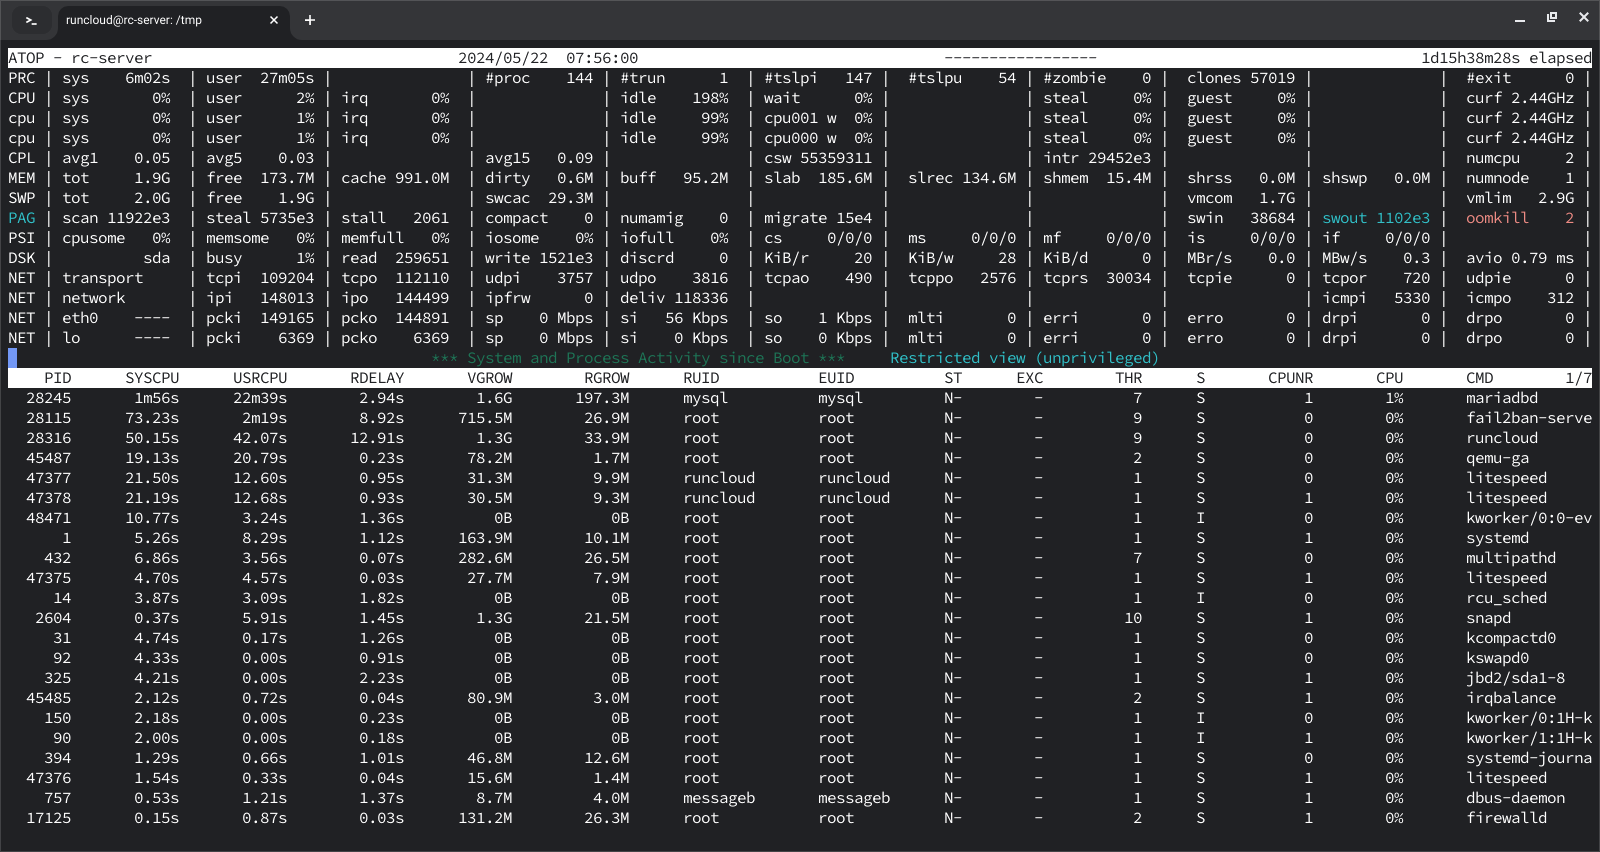
In the above example, we can see the system metrics and resource usage on the server using atop dashboard. To enable logging, you can configure atop to run as a daemon by editing the configuration file located at /etc/default/atop and set LOGINTERVAL to a desired value (e.g., 600 for 10-minute intervals).
Suggested read: What are Linux Logs? What Are They & How To Use Them
nmon
nmon (Nigel’s Monitor) is a system performance monitoring tool originally developed for AIX and later ported to Linux. It provides a comprehensive overview of system performance, including CPU, memory, disk I/O, network, and filesystem statistics. nmon is known for its lightweight design and efficiency, making it suitable for real-time monitoring and historical performance analysis.
To install nmon, first make sure that your package manager list is up to date, after that you can execute the following commands to download an run it:
sudo apt-get install nmon
nmon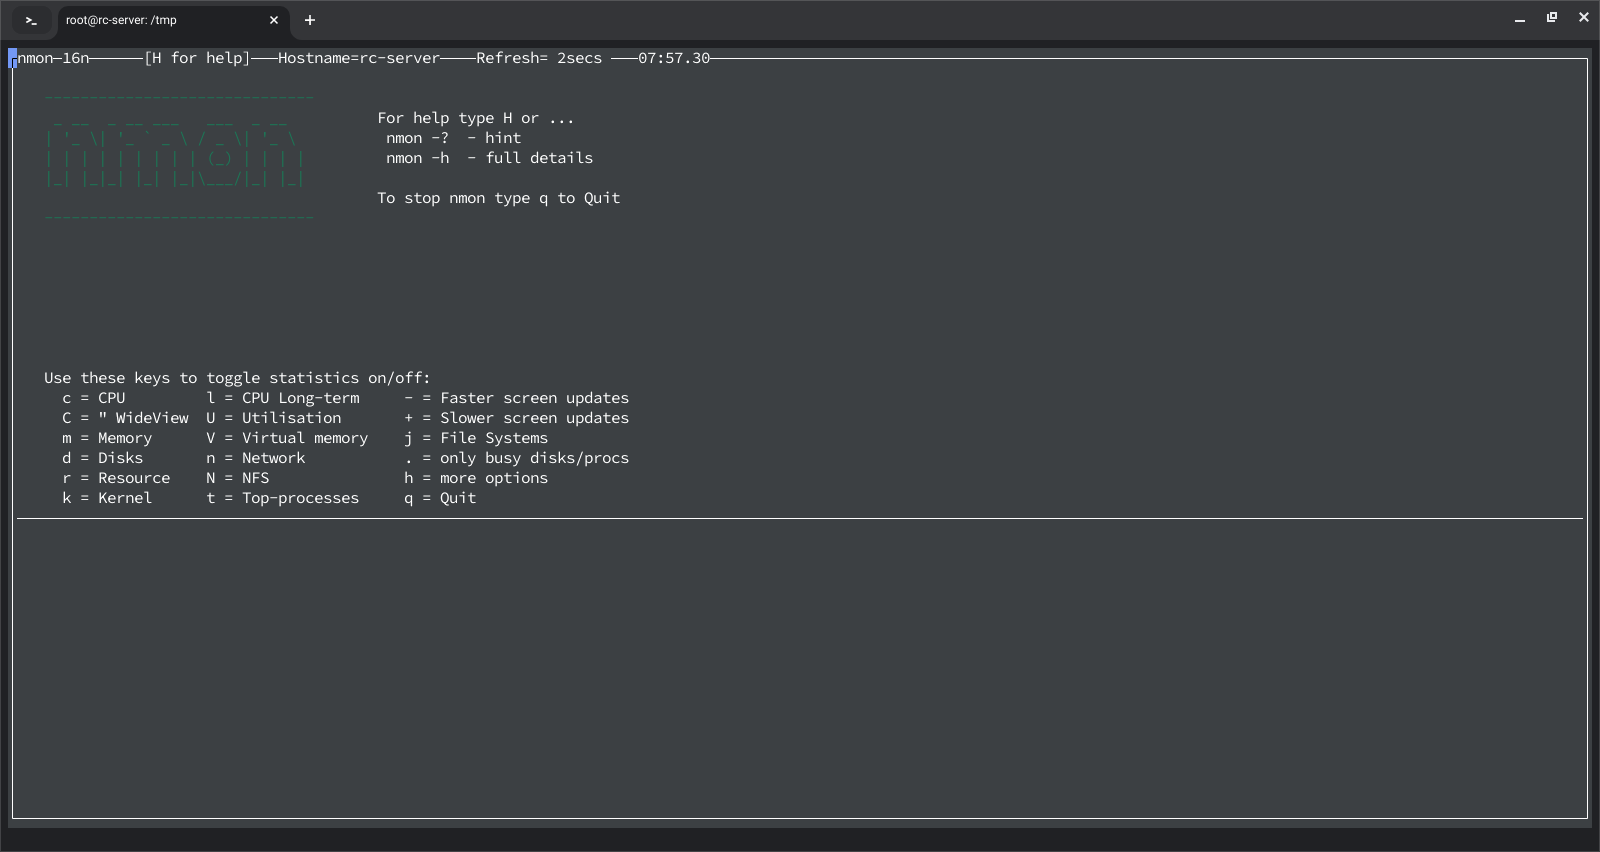
Once running, you can use various keyboard shortcuts to view different metrics. For example, press c to view CPU usage, m for memory usage, and d for disk statistics.
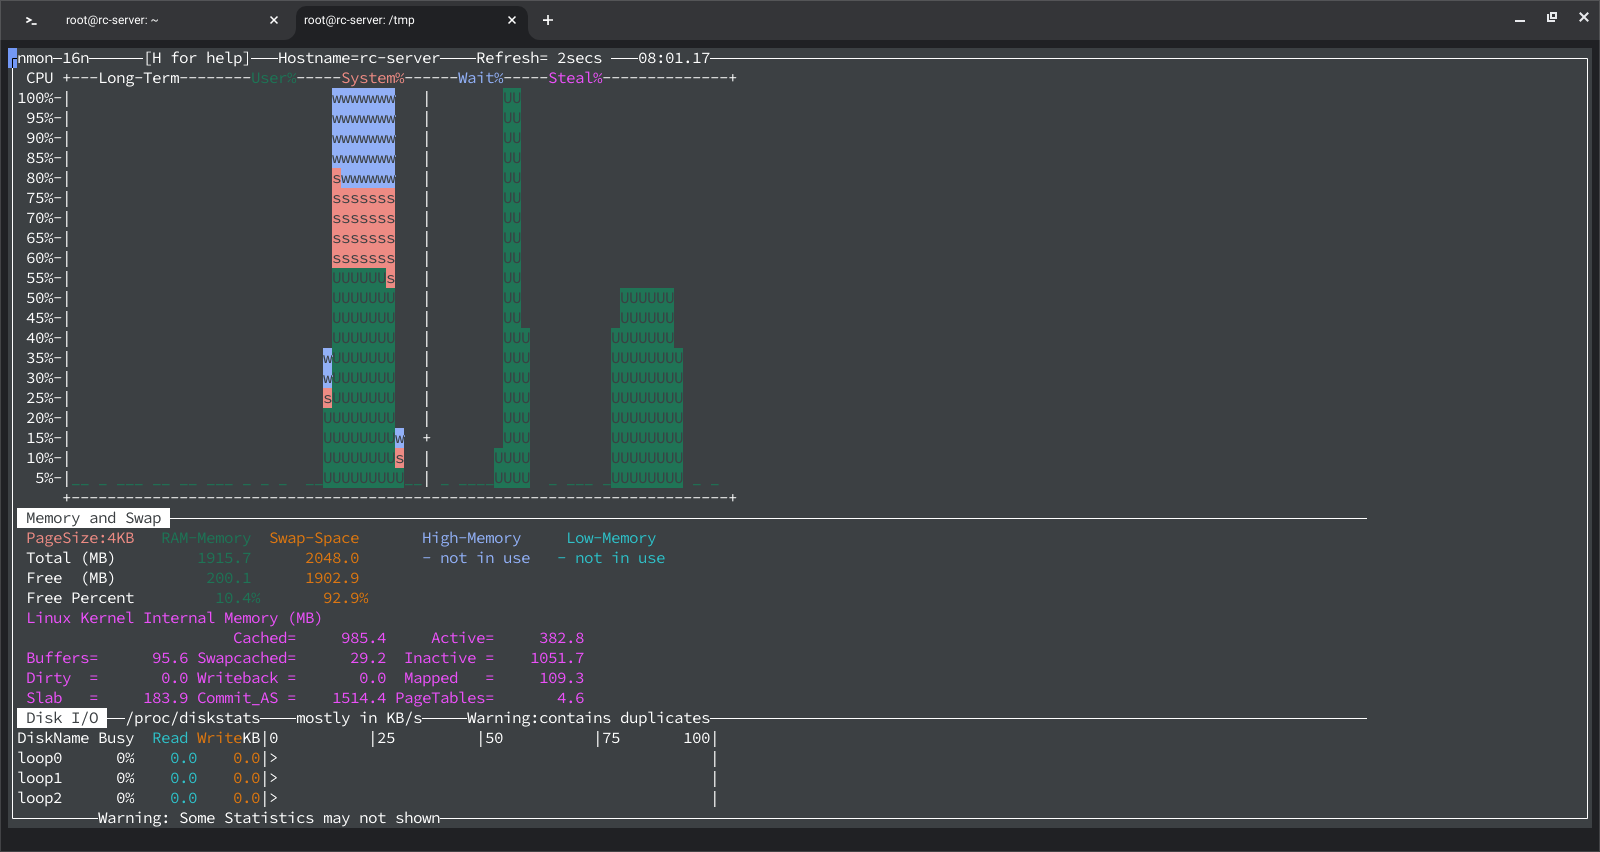
These alternatives to htop offer a range of features that can be tailored to specific monitoring needs, providing powerful tools for system administrators and users alike.
Suggested read: How to Create and Manage Cron Jobs on Linux
3 Best htop Alternatives for Mac
Mac users often require robust system monitoring tools to keep track of their system’s performance and resources. While htop is a popular choice, several other tools offer similar and additional functionalities tailored to macOS. Here are three of the best htop alternatives for Mac:
iStat Menus is a comprehensive system monitoring tool that integrates seamlessly with macOS. It provides real-time data on CPU usage, memory, disks, network activity, and other system metrics directly from the menu bar. iStat Menus is highly customizable, allowing users to choose which information to display and how to display it.
- Download: Visit the official iStat Menus website iStat Menus and download the latest version.
- Install: Open the downloaded .dmg file and drag the iStat Menus icon to your Applications folder.
- Launch: Open iStat Menus from your Applications folder and follow the setup instructions.
- Customize: Configure the tool to display the metrics you need from the menu bar.
Activity Monitor
Activity Monitor is the built-in macOS application that provides detailed information about the processes running on your Mac, as well as overall system resource usage. It offers insights into CPU, memory, energy, disk, and network usage, making it a powerful tool for everyday system monitoring.
How to Access Activity Monitor
- Open Finder: Click on the Finder icon in your dock.
- Navigate to Applications: Go to the Applications folder and then the Utilities folder.
- Launch Activity Monitor: Double-click on Activity Monitor to open it.
- Usage: Use the tabs to monitor CPU, memory, energy, disk, and network activity.
mactop
Latest Apple laptops use Apple silicone which was built using Arm architecture, this means that a lot of the software built for x86 chips is not compatible with latest Apple laptops. mactop is one of the few softwares which was specially built for Apple silicone and it is guaranteed to work with all the M1, M2, and M3 series chips.
You can download and compile the source code from its GitHub repository or simply download and install a pre-built binary directly using brew by using the following command:
brew install mactopOnce it is installed, you can start using it via the following command:
sudo mactop3 Best htop Equivalent Alternatives for Windows
Windows users looking for powerful system monitoring tools similar to htop on Unix systems have several good options available. These tools provide detailed insights into system performance, process management, and resource usage, making them indispensable for advanced users and system administrators. Here are three of the best htop equivalent alternatives for Windows:
Sysinternals Suite
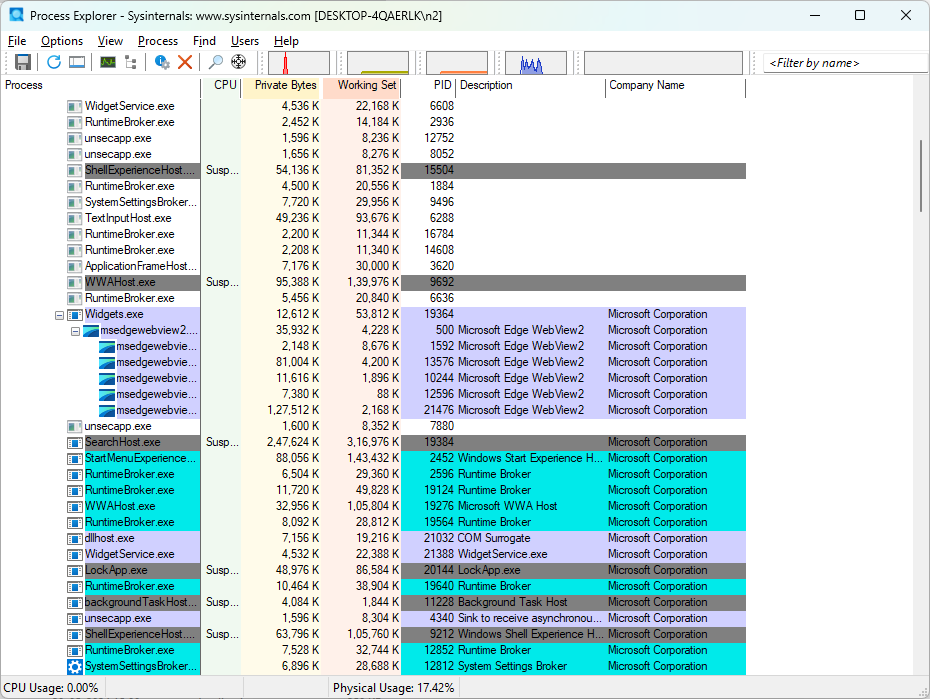
Sysinternals Suite is a collection of tools from Microsoft which provides detailed information about the processes running on your system, including the handles and DLLs that processes have opened or loaded. It offers a comprehensive overview of system activity, making it an essential tool for troubleshooting and performance monitoring.
How to Install Process Explorer
- Download Sysinternals Suite: You can either visit the Sysinternals Suite page to download the entire suite or manually download individual tools from SysInternals Live website.
- Extract the Files: After downloading the file, you can extract the downloaded ZIP file to a desired location.
- Launch Process Explorer: Navigate to the extracted folder and double-click on procexp.exe to launch Process Explorer. This will open a new window where you can explore different processes running on your computer.
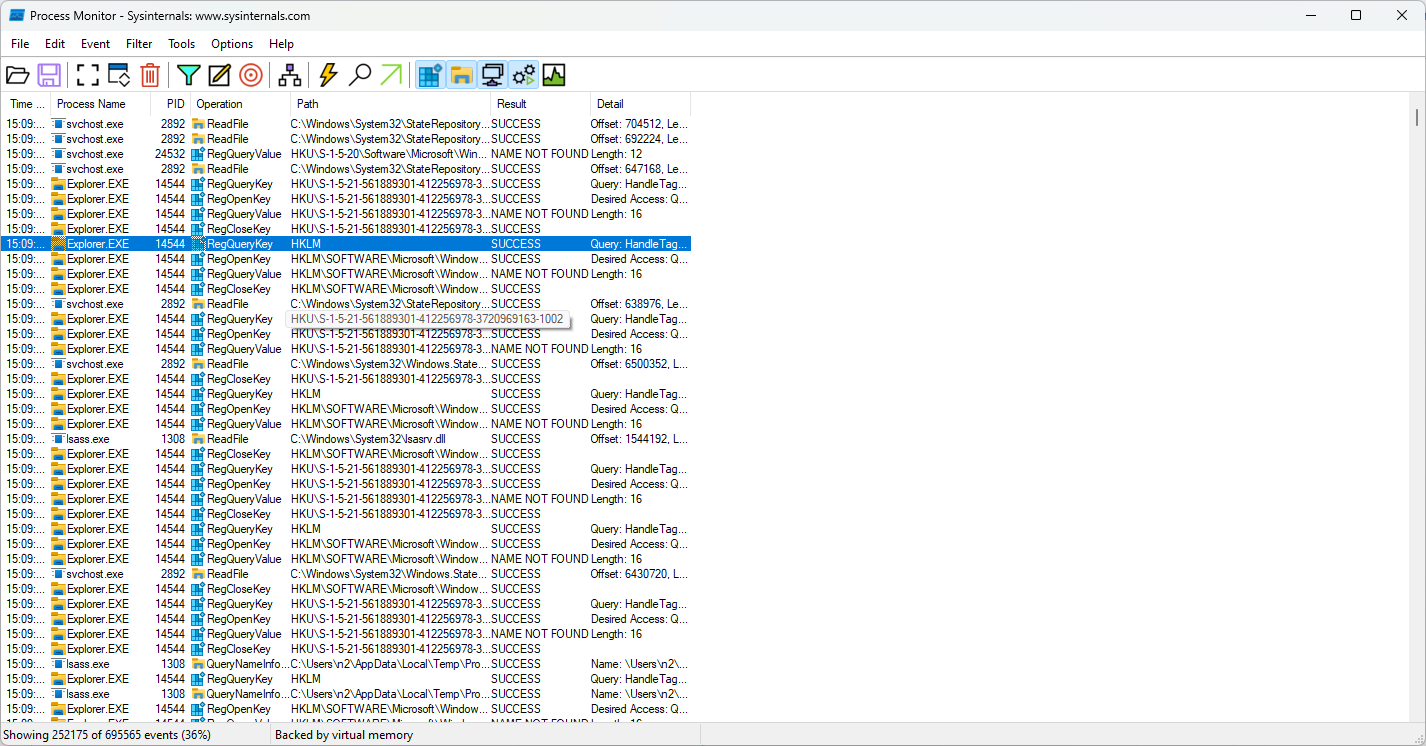
- Launch Process Monitor: In addition to process explorer, you can also launch the procmon.exe file to run the Process Monitoring tool. Once you have opened the tool, you can browse and manage different processes running on your system and forcefully terminate them if necessary.
Suggested read: How To Check Disk Space in Linux
Windows Task Manager
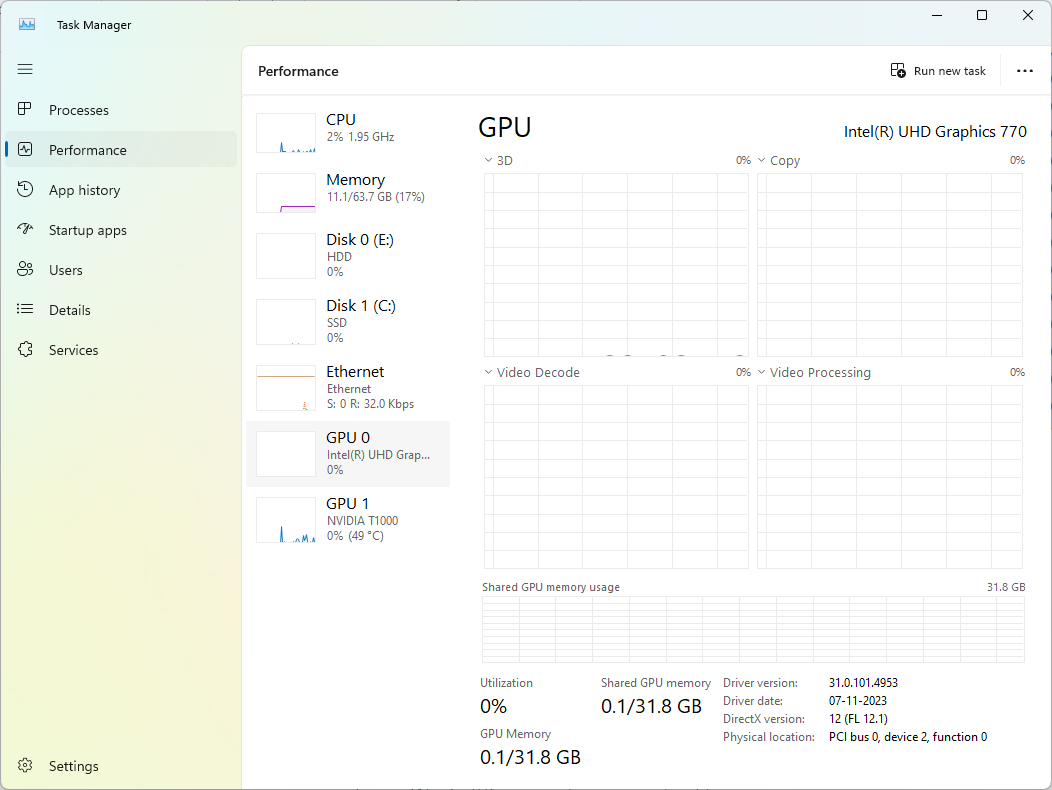
Windows Task Manager is a built-in system monitoring tool that provides real-time information on CPU, memory, disk, and network usage, as well as detailed process management. It is a powerful utility for basic and intermediate system monitoring and troubleshooting which can be used by anyone without needing to install any additional software.
How to Access Windows Task Manager
- Open Task Manager: On your Windows computer, press Ctrl + Shift + Esc or right-click on the taskbar and select “Task Manager”.
- View Processes: In the “Processes” tab, view the list of running applications and background processes along with their CPU, memory, disk, and network usage.
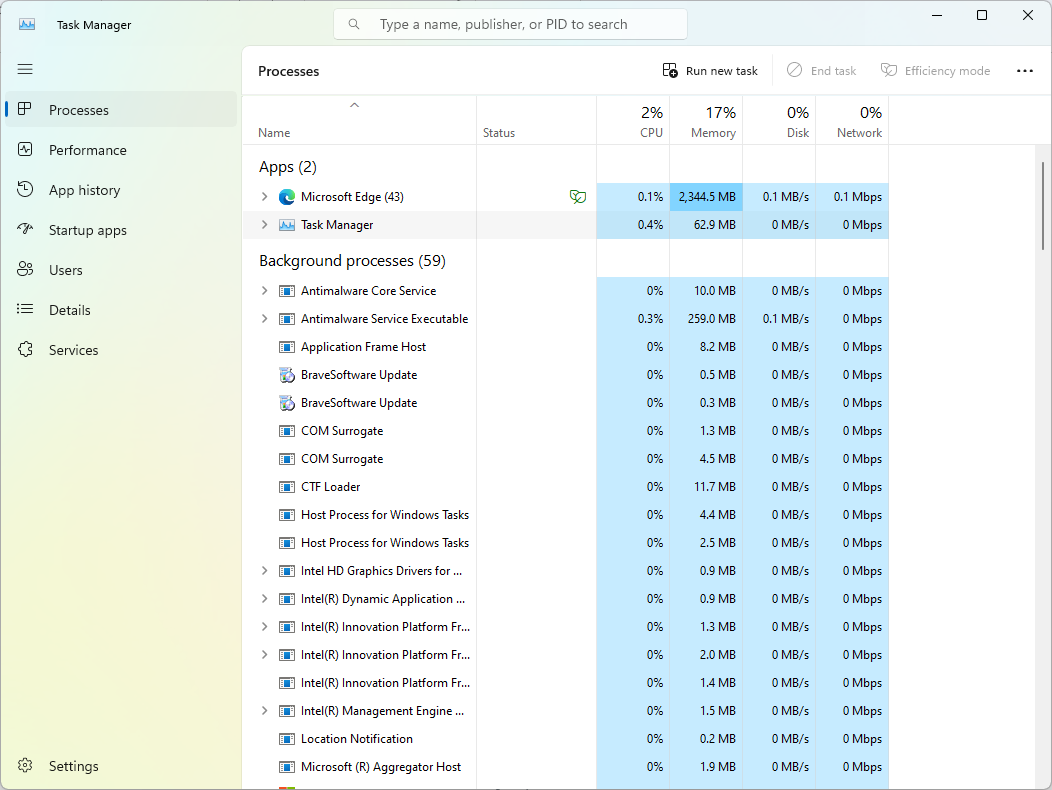
- Performance Tab: Click on the “Performance” tab to see an overview of system resources such as GPU, CPU, Memory, Network, and Disk.
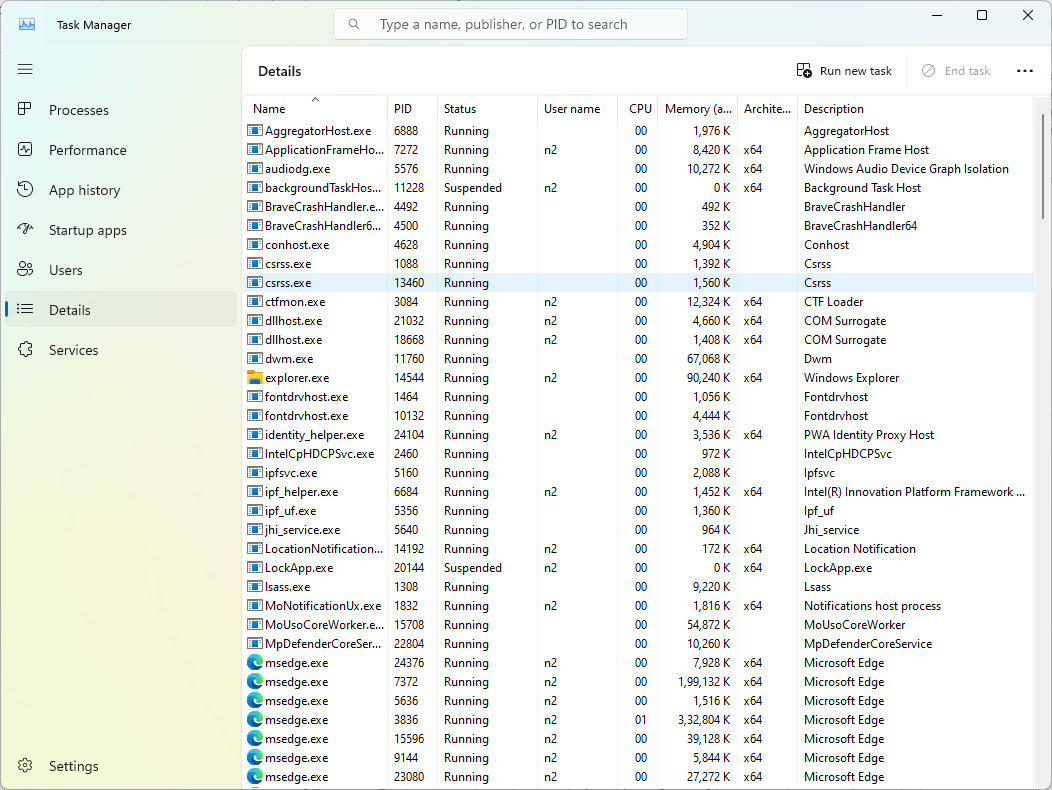
- Details and Services: If you want granular control over services, then you switch to the “Details” and “Services” tabs for more advanced process management and service control.
btop++
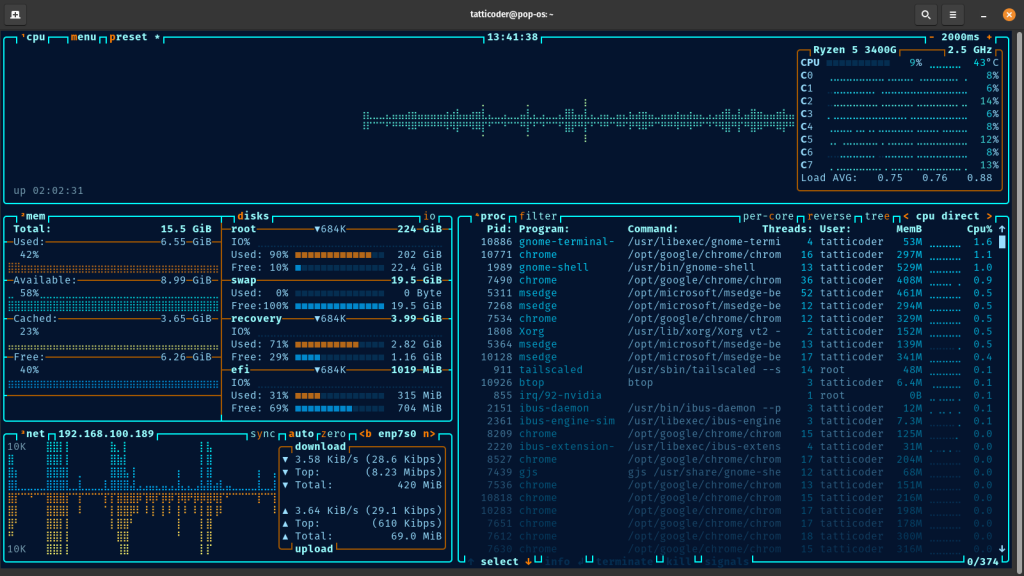
btop++ is an advanced system resource monitor that works on Windows, providing a detailed and visually appealing interface similar to htop. It offers insights into CPU, memory, disk I/O, and network usage, making it a versatile tool for system performance monitoring.
How to Install btop++
- Download: Visit the btop++ GitHub repository (also available for Linux) and download the latest release for Windows.
- Extract the Files: Extract the downloaded ZIP file to a desired location.
- Install Required Dependencies: Ensure you have Microsoft Visual C++ Redistributable installed, if not, download and install it from the official Microsoft website.
- Launch btop++: Navigate to the extracted folder and double-click on btop.exe to launch btop++.
- Usage: After installing it, you can use the interface to monitor system performance metrics and manage processes.
Wrapping Up
Monitoring system performance is crucial for maintaining optimal functionality and troubleshooting potential issues on your Windows, Mac, or Linux systems. While hTop is known to users for its comprehensive and interactive interface, there are powerful alternatives available across different platforms.
Recently, RunCloud has announced the addition of RunCloud Monitoring, a powerful tool designed to identify high resource usage and slow SQL queries on your server. This feature helps ensure that your servers are running smoothly and efficiently, saving you time and reducing the potential for downtime.
Whether you are managing a server or using a personal computer, having the right monitoring tools at your disposal is essential. Sign up for RunCloud today and take advantage of our comprehensive server management and monitoring solutions to keep your systems in top shape.

