With every system, especially servers, there is a need to find performance issues. The way to find the issues is to determine your system performance and monitor it over time. Seeing where and when issues arise can help you find solutions to the issues.
If issues arise for low performance for a Network Interface Card (NIC), then you need to look into increasing network bandwidth to the system or even Load-Balancing among multiple systems. If issues occur at a specific time of day, then you may need to change the time of specific jobs. Certain system jobs may be occurring at intervals too closely together. Spreading out automated tasks or jobs can alleviate the system stress placed on a machine.
Processes and Process IDs (PID)
With Linux systems, we can see the system processes in the /proc folder. If we change to the /proc folder, ‘cd /proc’, we can then see n example of the folder and file content in Figure 1.
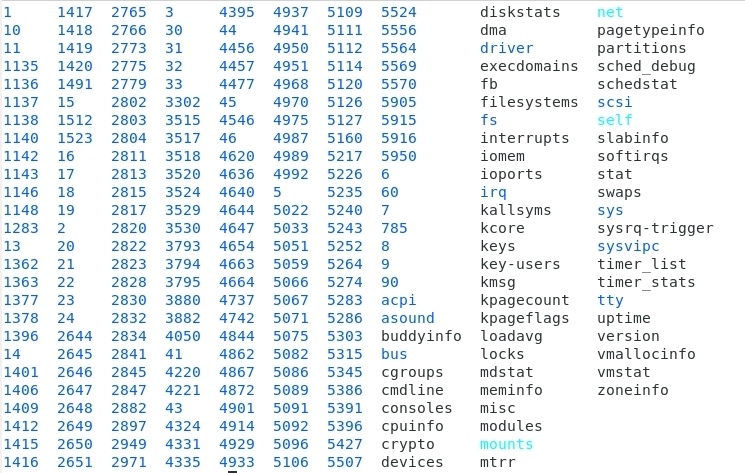
FIGURE 1
You can see that there are multiple folders with numeric names. Each folder is a process running on the current system. The number is the Process ID (PID). The folder contains the information for each process. If you want to find out which process the PID number is attached to then you can use the following command:
ps -p pid -o comm=
The parameter ‘pid’ should be replaced with the process id you for which are wanting to find the process name. For example, looking at Figure 1 you can see there is a PID of 32259. If I issue the command ‘ps -p 32259 -o comm= I would get a result of ‘firefox’.
Another way to find the process name is to change into the ‘/proc’ folder. Once in the ‘/proc’ folder you can list (ls) the contents. Find a PID and change into that folder. From the PID numbered folder you can type the command ‘cat stat’. The resulting output will start with the PID followed by the process name.
NOTE: These basics of the ‘/proc’ folder are only to give you a basic understanding that all process information is stored in the folders under ‘/proc’.
To install the necessary files for performance checking is done differently on CentOS and Ubuntu. Let’s look at CentOS first.
CentOS
To install the ‘procps-ng’ package for CentOS you need to execute the following command from a Terminal:
sudo yum install procps-ng
If you want to see all the files installed in the package you can use the command:
rpm -ql procps-ng
The results will show which files are included in the package. You should see files such as free, pgrep, pkill, pmap, ps and others.
Ubuntu
Procps is installed on Ubuntu by default. No extra steps need to be taken.
Be aware of the different commands and how to use them.
To see the contents of the package you can use the command ‘sudo apt show procps’.
Package Commands
Keep in mind that the command ‘free’ shows the amount of memory in your system. The output shows Total, Used, Free, etc as shown in Figure 2.

FIGURE 2
Checking the ‘free’ command can show you statistics for the memory to see that there is adequate memory available. If the ‘Available’ memory is low then you need to add RAM to your system.
NOTE: Know that the value is in bytes. To get the values in Megabytes (MB) you can use the command ‘free -m’.
To see how much memory a Process is using you can use the command ‘pmap pid’. The parameter ‘pid’ should be replaced by the Process ID you are wanting to check. If you have a program that seems to take up a lot of memory you may want to check the ‘pmap’ command output for the process. If the values keep climbing then you might have a memory leak. A memory leak is where a program keeps allocating more memory without releasing it back to the system. The issue is caused by incorrect programming techniques or a compiler that has a fault. A memory leak can bring a system to a standstill and a system crash when the memory is full.
You can check the current working directory of a process by using the command ‘pwdx pid’. As usual, the parameter ‘pid’ is replaced with the PID of the process you are checking. In a Terminal, you can type the command ‘echo $$’ to get the current PID of the Terminal. Use the output PID to run the command ‘pwdx pid’. The result should show your Home folder unless you changed directories. If you want to check the folder of any process you can find the PID first. If I have Firefox running, I can find the PID with ‘pgrep process’ where ‘process’ is the process name. The command ‘pgrep firefox’ returns a value of 32259 on my system. I can then find the current working directory with the command ‘pwdx 32259’ and get a result of ‘/home/jarret’, which is my Home folder. If programs are not executing properly then you can verify that the program is running from the proper folder so that it finds all the necessary files it needs.
Another important utility is to see how long the system has been active. The command to check this is ‘uptime’. The output is the current time followed by the time that the system has been on. The number of users connected to the system is given. The last bit of information is the load average for 1 minute, 5 minutes and 15 minutes. If the system contains a single processor (core) then the values are based on 1.00. If two processors (cores) are in the system then the maximum values are 2.00. Watch these values so they do not get too close to the number of cores in the system. These values can also be obtained by the command ‘cat /proc/uptime’. The results show two numbers. The first is the number of seconds that the system has been up. The second number is the idle time for the CPUs. The more cores in the system will result in a higher idle time if the system has been idle. If the number is low then the CPUs are receiving a lot of requests. Similar values can be found with the command ‘cat /proc/loadavg’. The first three values are the load averages within the last 1 minute, 5 minutes and 15 minutes. The fourth set consists of two numbers. The first number is the number of running processes. The second number in the set is the total number of processes. The last number is the last PID given to a process.
A command that shows most of this information in one command is ‘w’. It is a mixture of ‘uptime’ and ‘who’. The output is shown in Figure 3.

FIGURE 3
NOTE:
For more information on your CPUs you can use the command ‘lscpu’.
If you want to monitor the changing values on a command, such as ‘uptime’, you can use the ‘watch’ command. For example, to see the values every 5 seconds you can use the command ‘watch -n 5 uptime’. You can use the command to watch any other command’s output. The amount of time you specify will vary depending on the value you put after the ‘-n’.
You can watch the current system load with the command ‘tload’. You will see the normal three numbers giving a value of the average load. There is also a graphical representation of the load as time passes.
The command ‘top’ can also be of value. Each process is shown as well as the amount of memory used by the process. There is also a column for the CPU percent being used by the process. Other information is given by the command and you should look into the command. To see changes you can run it in batch mode and specify the number of times to check. The command is ‘top -b -n#’ where ‘#’ is the number of times to check the values.
Another command to give individual information, instead of whole system averages, is ‘vmstat’. The output is shown in Figure 4. Here, you can see there are six sections of data: Process, Memory, Swap, IO, System and CPU. Each section is split into categories. For example, The Processes section has two subcategories: Running processes (R) and Blocked (B) processes.

FIGURE 4
You can check the MAN pages for more information on the output of the command.
System Monitoring
You can install ‘sysstat’ to constantly monitor your system to provide you with real-time information from previous days or the present day.
The ‘sysstat’ package can be installed under CentOS as well as Ubuntu.
For CentOS you run the command ‘sudo yum install sysstat’ and for Ubuntu, the command is ‘sudo apt install sysstat’.
Once installed you can execute the command ‘cat /etc/cron.d/sysstat’.
The first line shows that a job is performed every ten minutes as Root. The job is the script ‘/usr/lib64/sa/sa1’. You can display the script with ‘cat /usr/lib64/sa/sa1’.
The last line shows another script running at 11:53 P.M. that is a script named ‘sa2’. The ‘sa2’ script is found at the same location as ‘sa1’.
NOTE: The file location in Ubuntu is ‘/usr/lib/sysstat’ for ‘sa1’ and ‘sa2’.
To see the configuration file for setting the compression type, times, etc you can look in ‘/etc/sysconfig/sysstat’ for CentOS and ‘/etc/sysstat/sysstat’ for Ubuntu.
For both CentOS and Ubuntu you can start the ‘sysstat’ process with the command ‘systemctl start sysstat’. You should need to type in the password to allow the process to start. If you want to enable the service to auto-start at boot you can use the command ‘systemctl enable sysstat’.
With either Operating System (OS) you can now use the command ‘iostat’ to get the current statistics for the CPU and hard disks. You can get multiple listings with a gap in between the listings if you want to check the I/O over a specified time. You can use the command ‘iostat g I’. Replace ‘g’ with the number of seconds to have a gap between the iterations. Replace ‘I’ with the number of iterations to perform. You may want to perform the listing when you know a specific task will perform a lot of hard disk reads and writes.
If you want to create a report of sorts from ‘sysstat’ you can use the ‘sar’ command. The command ‘sar -u’ will list a snapshot of the system statistics from every ten-minute snapshot taken. It will also list every restart the system performs. An example can be shown in Figure 5.
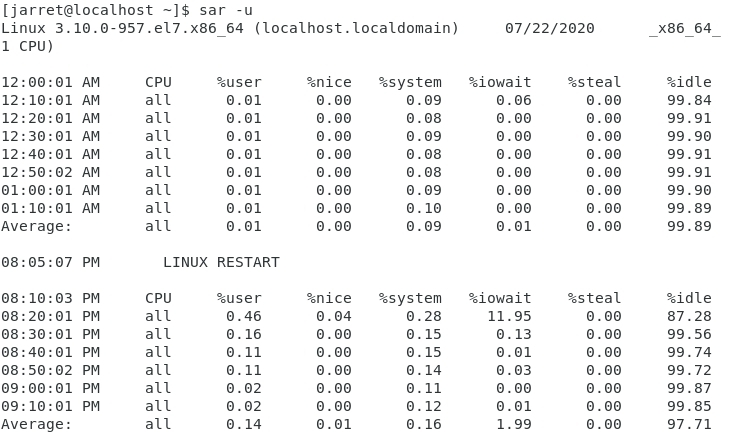
FIGURE 5
Of course, I am getting a report from my laptop which has not been doing too much. It does show you the basic gist of what is reported.
For statistics of specific areas of the hardware you can use the following:
sar -r → Memory
sar -q → Load Average
sar -u → CPU
sar -n DEV → Network Devices
If you need more assistance try ‘man sar’ for more help.
Conclusion
I hope this helps you to monitor your system and find fixable issues that will help you improve your performance.
Be aware that running ‘sysstat’ for a longer period can show trends that may alert you to issues.
If you are wanting to be LFCS certified, then make sure you look over these commands and test them on a system, even if it may a virtual one.

![Upgrading Proxmox version [Proxmox Series #7]](https://linuxpunx.com/wp-content/uploads/2023/09/upgrading-proxmox-version-proxmox-series-7-768x432.png)
