In this post, I will discuss how automatic metering and reporting by VMware Usage Meter 4.2 works with VMware Cloud Director Availability.
Cloud Director Availability Enhancements
Contents
With version 4.0, VMware Cloud Director Availability (VCDA) introduced enhancements that detect if a Usage Meter instance is connected to the Cloud Manager instance. If it’s not, the provider administrator will see an orange banner that shows Usage Meter connectivity is not established –

Furthermore, we will see this under System Monitoring -> Service Status:

Usage Meter 3.6.1 Hot Patch 4 (or greater) and Usage Meter 4.2 are compatible with VCDA. Once connected, the banner will be removed and we will see that Usage Meter connectivity is healthy.

I will be using Usage Meter 4.2 for my reporting. While I am using 4.2 for this setup, the behavior and reporting functionality remains constant between these two different Usage Meter versions.
Usage Meter 4.2 Setup
With Usage Meter 4.2, we have introduced several new products for automatic metering and reporting:
- Cloud Foundation
- NSX-T
- vRealize Network Insight
- Horizon Desktop as a Service (HDaaS)
- Cloud Director Availability
To add a VCDA instance, one requires the root appliance credentials and the FQDN of the Cloud Replication Manager –

Once inputted, one must accept the certificate within Usage Meter for proper metering –

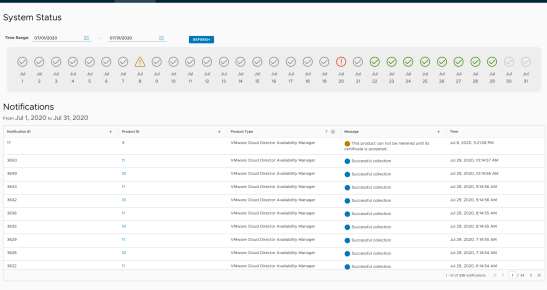
Upon completion, the provider will see a healthy status along with successful collections within the Notifications section.


VMware Commerce Portal and Usage Insight – Automatic Reporting
As discussed prior, Usage Meter 4.x architecture separates metering and reporting functionality. All reporting functionality happens within the VMware Commerce Portal while Usage Insight manages the reporting functionality.
In my test instance, I have my Usage Meter 4.2 instance registered to a contract within the Commerce Portal. If I was using this for Production state, this would be configured in Production mode rather than Test.

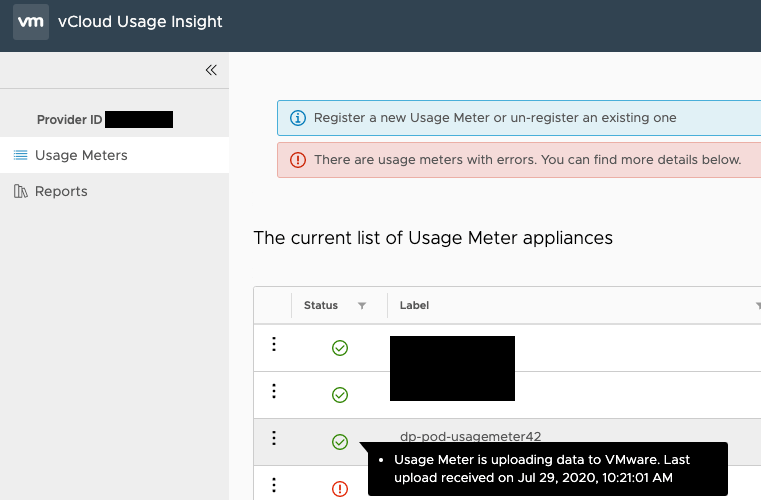
Clicking on the link to redirect to Usage Insight allows one to further manage this instance.

From the Reports tab, we can generate in-month usage reports along with the VM History Report –

The VM History Report can be downloaded as a tab-separated value (TSV) file and viewed in Excel. However, all personally identifiable information is hashed by the source Usage Meter. One can see feature detection for vROps, NSX, vRNI, and VCD.

As for the logic of breaking out protected instances versus migrations, this logic has remained the same since metering was introduced with version 3.6.1. This blog post explains how this works in further detail.
Automatic Reporting
While the above shows a walkthrough behind the scenes, all reporting to the Commerce Portal is automatic. Therefore, the provider will only need to accept the results for the calendar month and process accordingly.
Video Walkthrough
I recorded a quick video that shows the ease of setting up Usage Meter 4.2 metering with Cloud Director Availability. As one can see, this is rather simple.
Summary
In summary, automatic reporting and metering is very simple with VMware Cloud Director Availability. Moreover, with automatic reporting, this removes the monthly operational overhead required to gather usage for a VMware Cloud Provider environment.
Originally posted on https://www.paluszek.com/wp/2020/07/29/vmware-cloud-director-availability-and-usage-meter-4-2-automatic-metering-and-reporting/


