Understanding usage is key for providers to plan and study the consumption of cloud services of their end customers in VMware Cloud Provider Hub.
In the previous blog, I covered the different features of Usage for Provider and tenant that VMware Cloud Provider Hub offers. In this blog, I will explain the detailed usage report and interpreting the calculation behind aggregated usage and effective usage of a SKU for a service consumed using an example of host usage in VMware Cloud on AWS.
This blog requires prior knowledge of basics of VMware Cloud Provider Hub and part 1 of this blog series.
How to interpret usage displayed in VMware Cloud Provider hub
Contents
- 0.1 How to interpret usage displayed in VMware Cloud Provider hub
- 1 Additional Resources
Usage is available for the usage period in arrears for the services consumed in VMware Cloud Provider Hub.
In order to understand the usage displayed in VMware Cloud Provider Hub, we need to understand some key definitions and basics of pricing for the service for which usage is explained – here VMware Cloud on AWS.
Some key definition
What is a SID
- It is an unique alphanumeric identifier assigned to a customer account for ordering purposes
On-demand SID
- Is a SID, which is created when service is activated for the very first time and all on demand usage for that organization appears under this SID. It does not have an end date.
Term or reservation SID
- Is a SID which is created for every term subscription in that organization for each service. Based on whether it is a 1-yr or 3-yr term subscription, the end date will vary
Overage
- Overage charges is the charge that appears every month in the bill in Business Portal and this DOES NOT appear in VMware Cloud Provider Hub
VMware Cloud on AWS and host usage
VMware Cloud on AWS is a service on VMware Cloud Provider Hub, which is an integrated cloud offering jointly developed by AWS and VMware to deliver a highly scalable , secure and innovative service that allows organizations to seamlessly migrate and extend their on-premises VMware vSphere-based environments to the AWS Cloud running on next-generation Amazon Elastic Compute bare metal infrastructure.
VMware Cloud on AWS usage can be for compute, storage or network. The hosts usage can be of two types – On-Demand Instance and Reserved Instance .
On-Demand Instance
Hosts are spun up always on demand. On demand consumption for VMware Cloud on AWS starts when you hit DEPLOY SDDC in VMware Cloud on AWS service
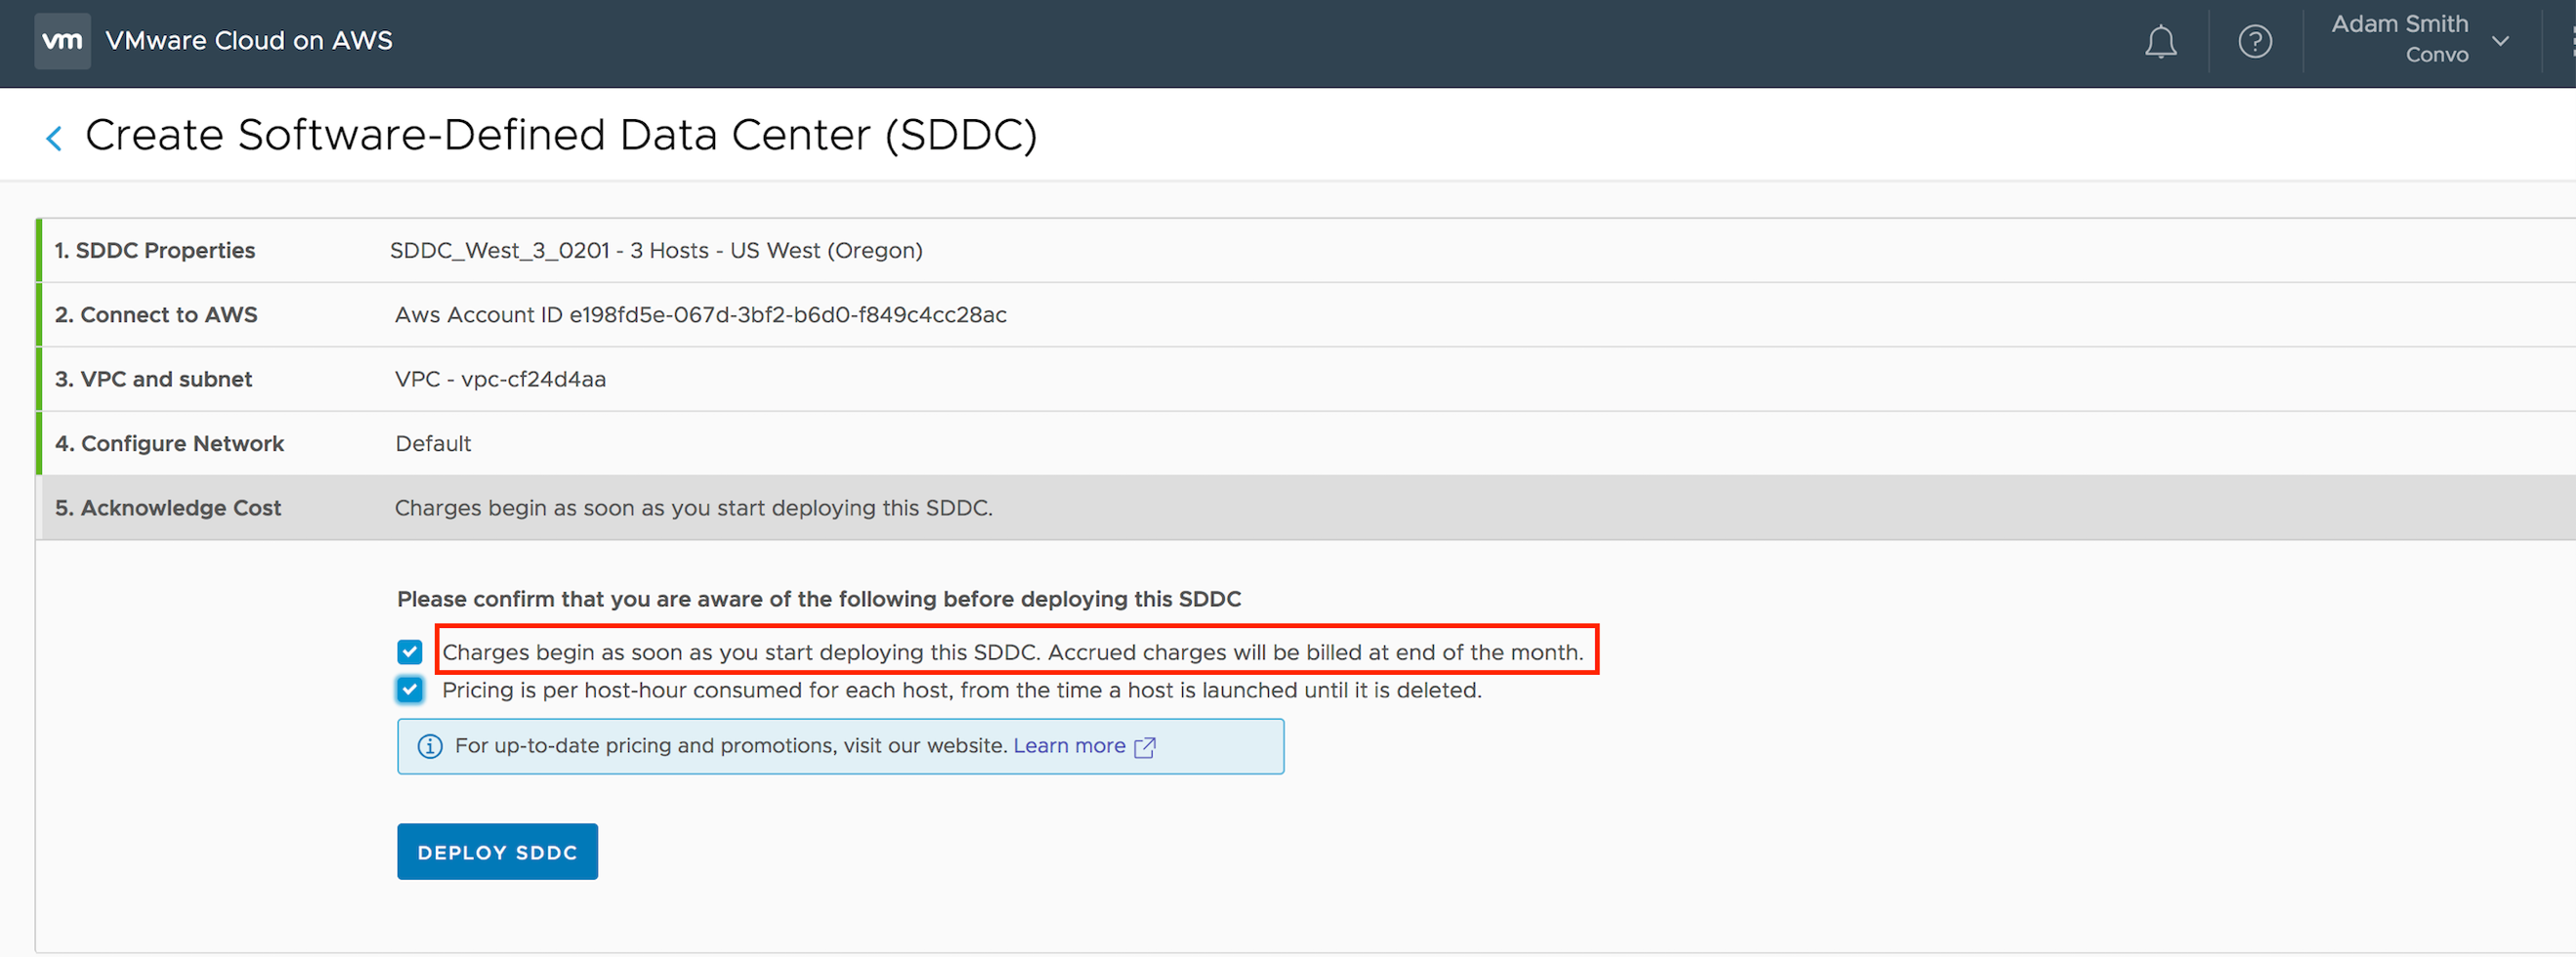
In our example
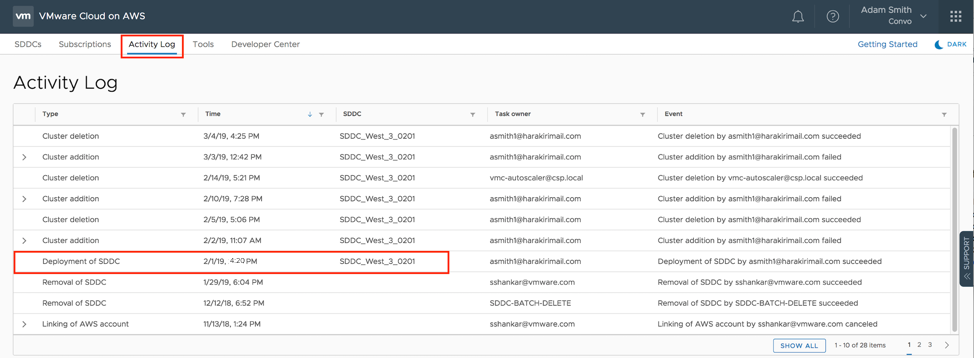
One SDDC with 3 hosts is deployed in US West on 1st Feb 2019 at 4 PM Palo Alto time zone

The time can be also obtained from the Activity Log of the service
The number of hosts running for every hour appears under Usage Qty in the downloaded usage csv file in VMware Cloud Provider Hub.

Note: This csv file can be downloaded only for usage in arrears. Here it can be downloaded only after 5th March 2019
Reserved Instance
A reserved instance is not a physical instance.
- It is a billing discount applied to the usage of the On-Demand instance .
- It is only applicable against the On-demand instance in the same organization and same region
- It is created in VMware Cloud on AWS service under Subscriptions.
- It has a long term commitment of 1 or 3 years.
- It is paid upfront regardless of whether the instance is being used.
Here a reserved subscription is created for 1 host in US West Oregon.
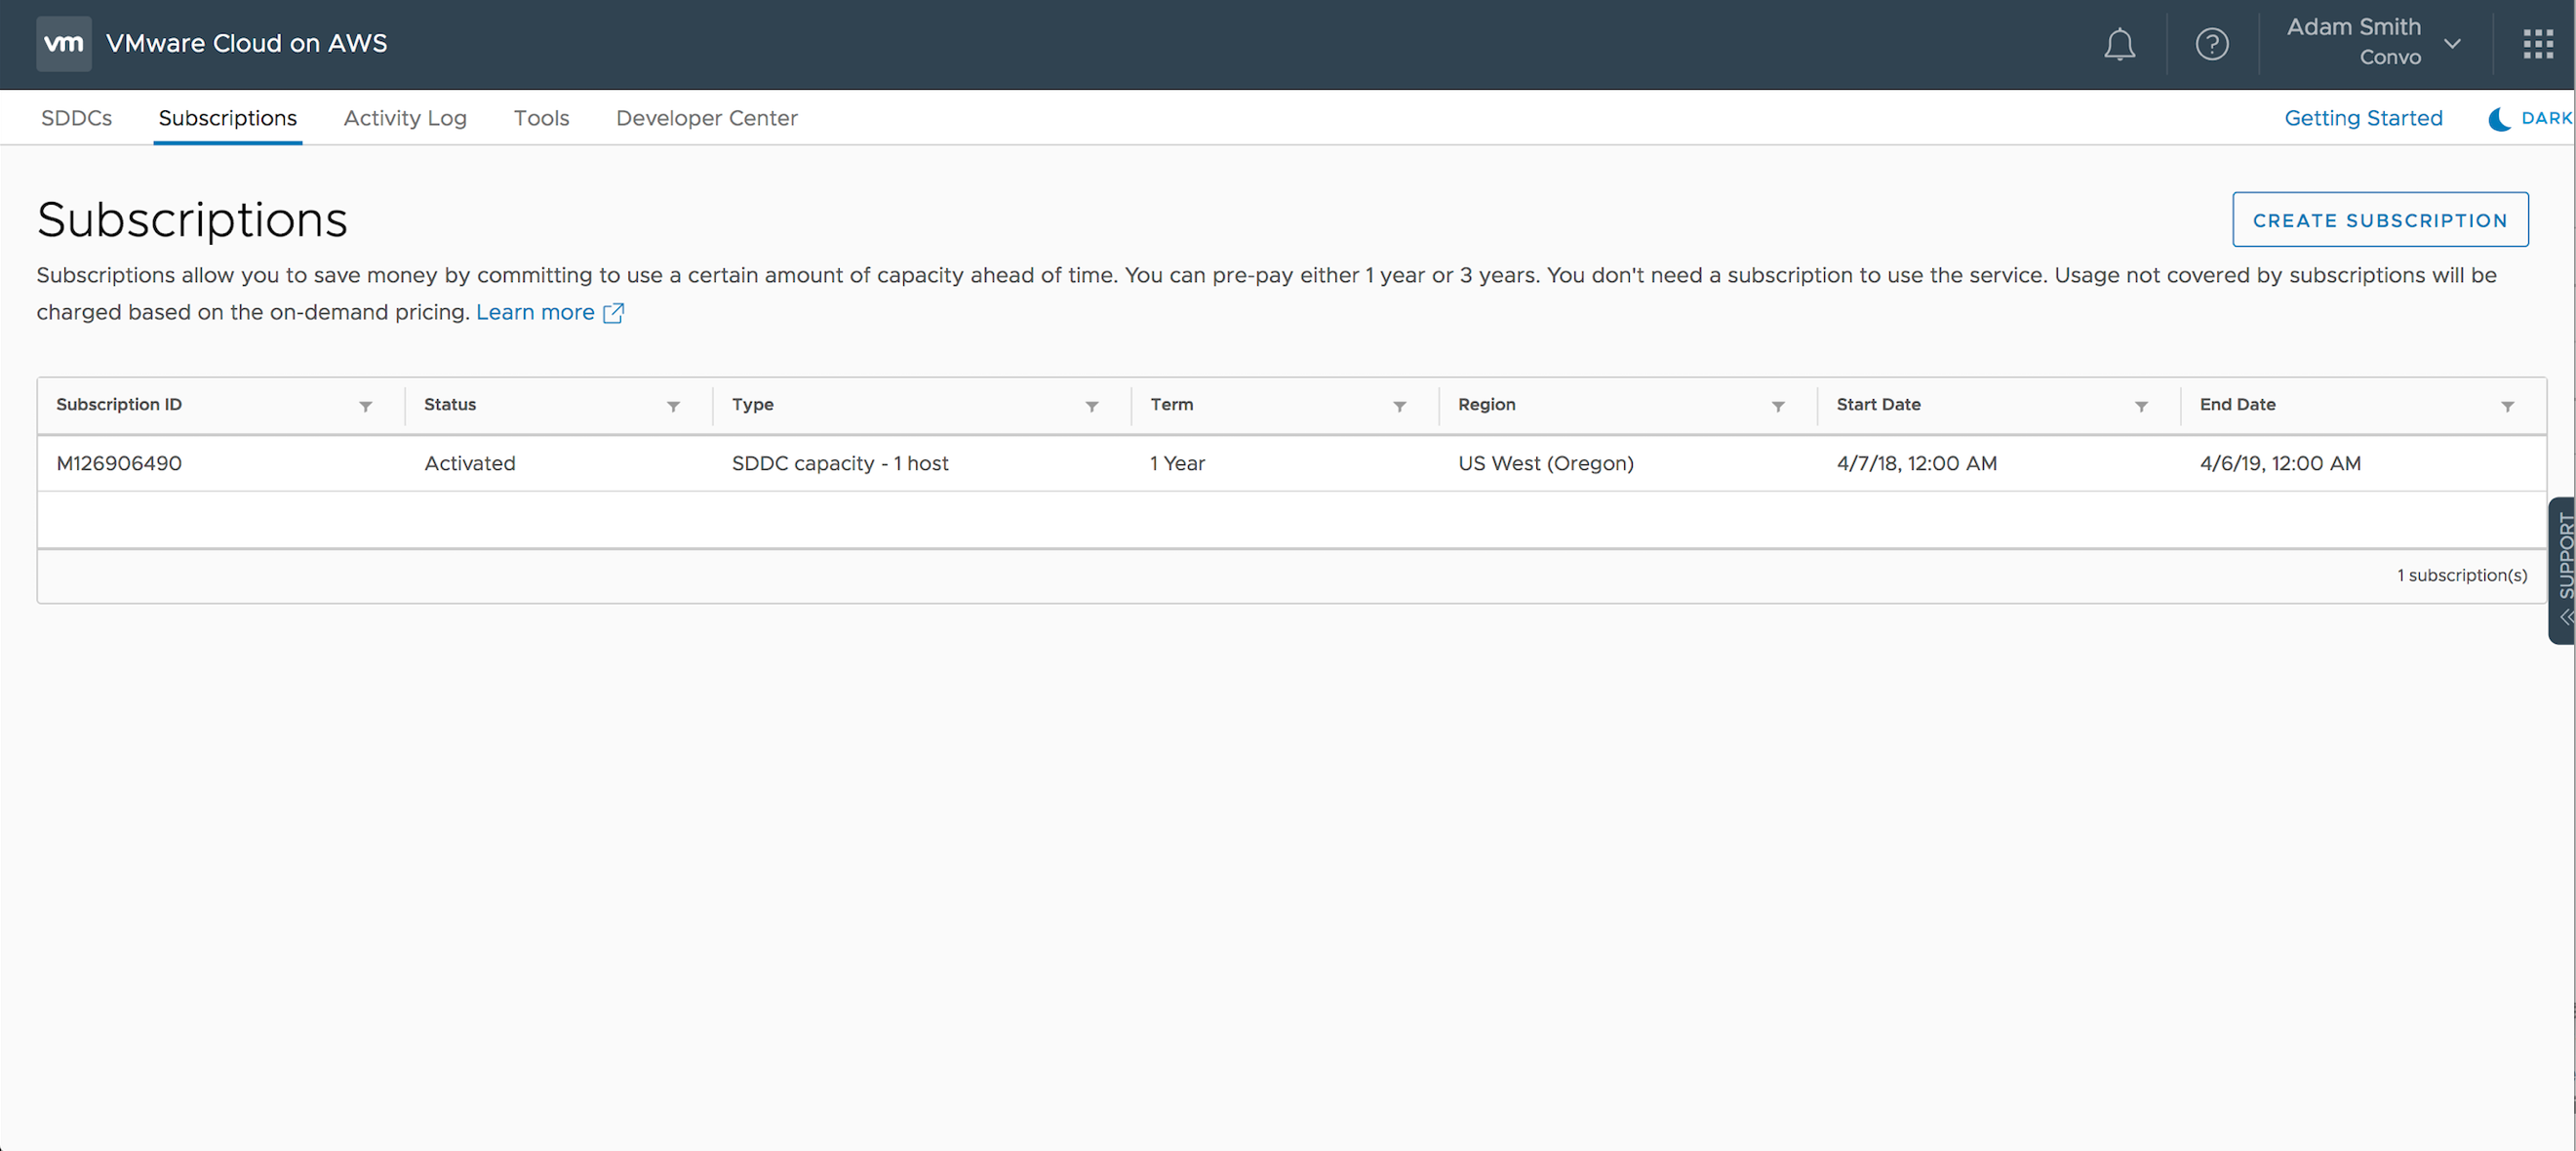
The number of reserved hosts against that sku appears as Commit Qty in the downloaded usage csv file from VMware Cloud Provider Hub.

Hourly overage host usage calculation
The hourly overage usage calculation for host is computed as below
- Number of hosts running in that organization per hour appears as Usage Qty
- Number of reserved instance in that organization in that region appears as Commit Qty
- Billable Qty = Usage Qty – Commit Qty

For the first hour the billable qty is 1.20667 host hour
For the second hour the billable qty is 1 host hour and so on…
Line Items in downloaded usage report for VMware Cloud on AWS service
The line items in downloaded usage report VMware Cloud on AWS service for the period of Feb 2019 has been explained with numbered list.
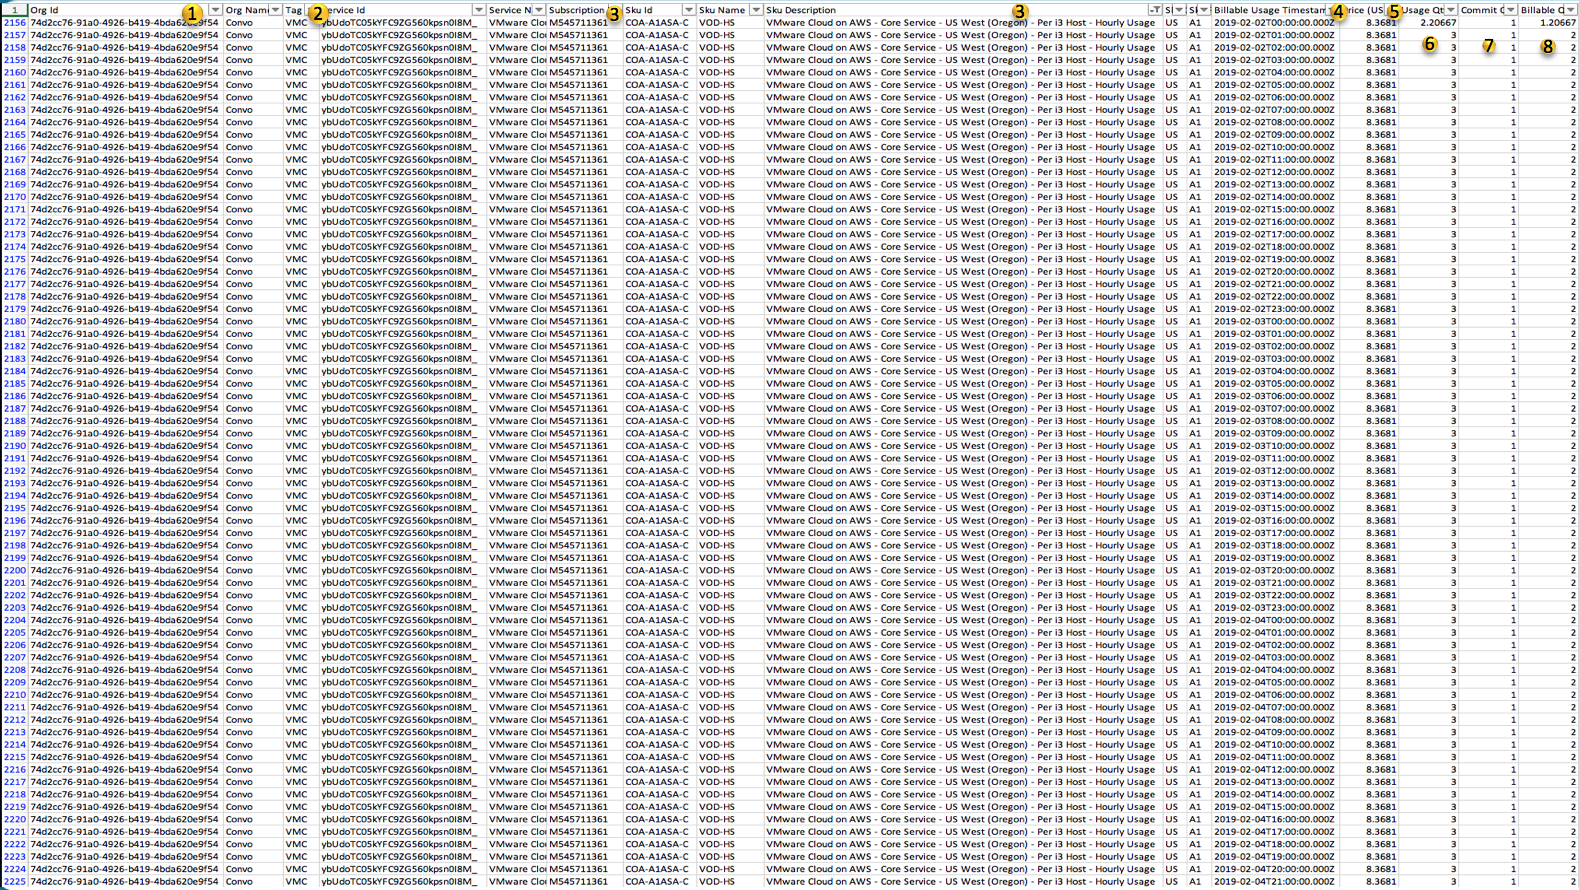
- tenant org id
- tag – A unique identifier for each organization particularly used in apis for filtering
- on-demand SID – here – M545711361
- sku for host in US West (Oregon) as the SDDC was deployed in US West – here – VMware Cloud on AWS – Core Service – US West (Oregon) – Per i3 Host-Hourly Usage
- Billable Usage Timestamp – Is logged every hour for the host from the time the hosts were deployed and till they are up and running.
- The time is in UTC . So since the SDDC was deployed on
- 1st Feb 2019 at 4:20 PM, the timestamp appears as 2019-02-02T00:00:00.000Z
- The time is in UTC . So since the SDDC was deployed on
- Price – Is the MSRP list price for that sku
Here the MSRP price $8.3681 for one host in US West and this field always displays the latest price. For any pricing details refer to latest pricing here.
- Usage Qty is the number of hosts deployed on demand – here 3 hosts on demand for the second hour = 3
- Commit Qty is the quantity to indicate the number of reserved instance – here reserved instance (a.k.a subscription) was created for 1 host in US West = 1
- Billable Qty per hour is the Usage Qty – Commit Qty – On-demand host usage per hour for that sku minus no of reserved instance (subscription) = 3 – 1 = 2 hours of host usage for that sku
Mapping the host usage between downloaded usage report and as it appears in VMware Cloud Provider Hub
If we sum all the Usage Qty for the host sku in the downloaded usage report for the sku COA-A1ASA-C we get the aggregate usage in VMware Cloud Provider Hub.
Similarly if we sum the Billable Qty for the host sku in the downloaded usage report for the sku COA-A1ASA-C we get the aggregate effective usage in VMware Cloud Provider Hub

Usage in Hub for the sku – The aggregate usage and aggregate effective usage appears in hub as below
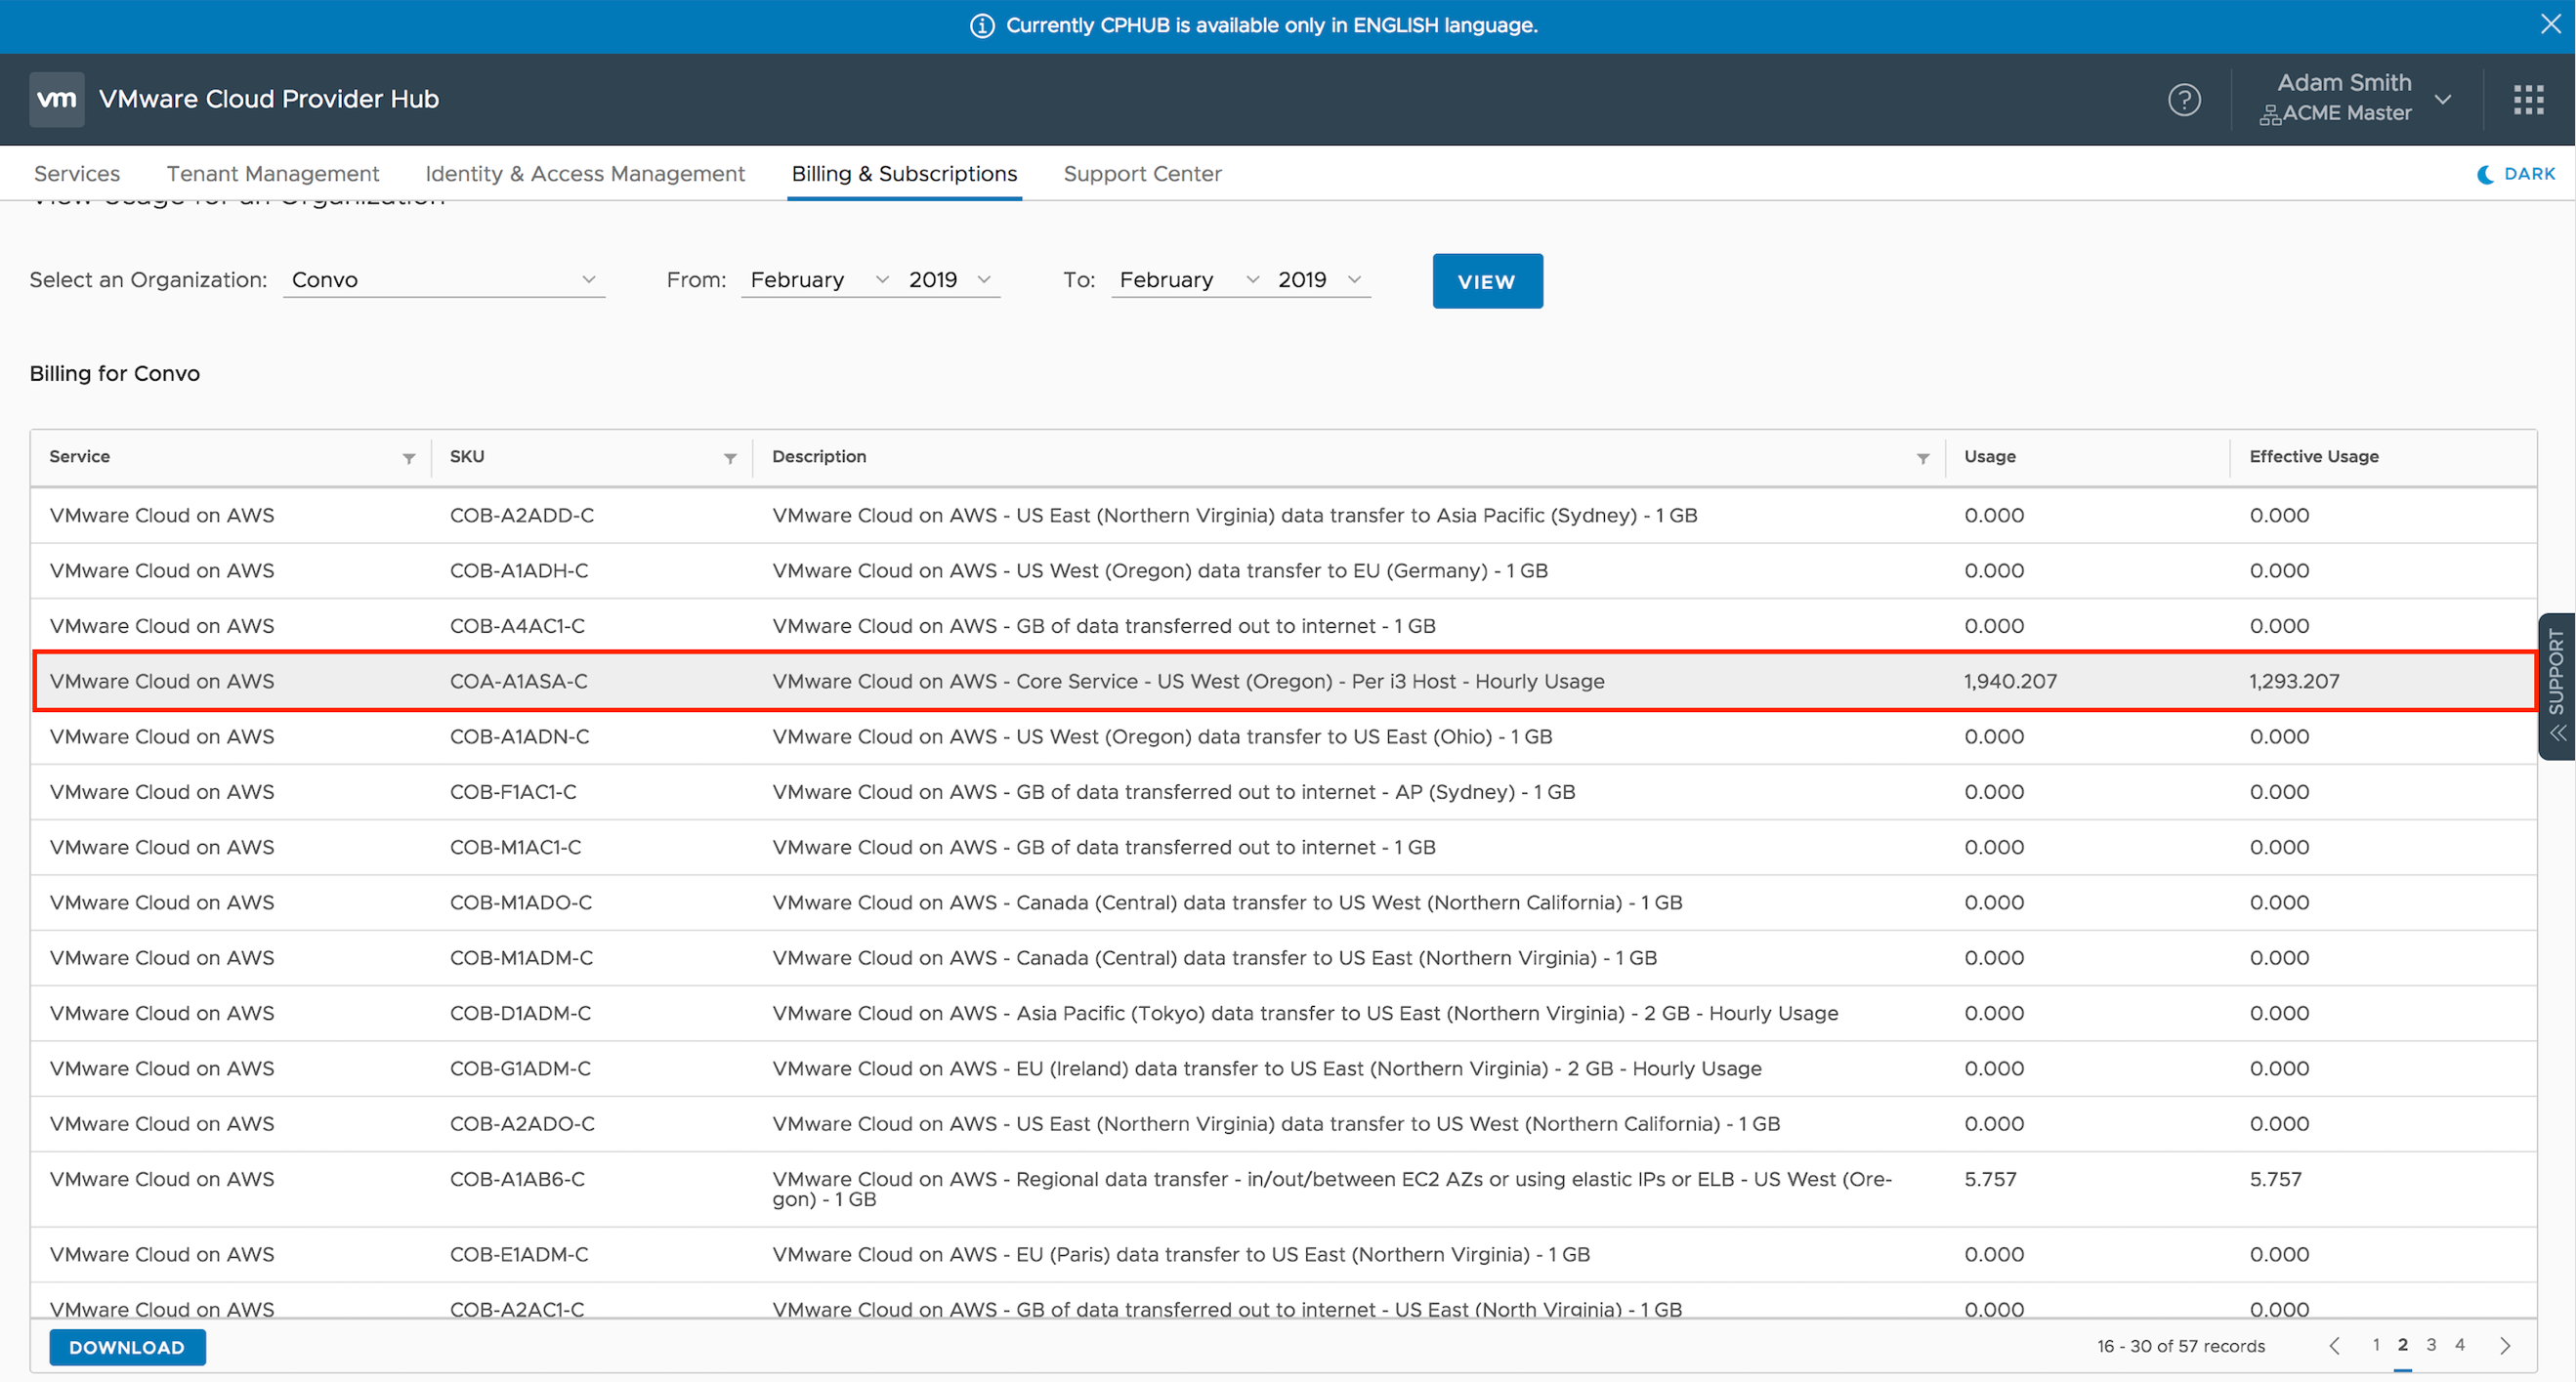
As you can see, it is extremely simple to view and download the aggregated usage report or detailed hourly usage report for any organization , be it provider organization or tenant organization. Consolidated report for all organization can also be downloaded by the provider.
End customers can view their prior aggregated usage per sku for all services consumed for their organization.
In part 3 , I will provide examples using usage api.
Additional Resources
Learn more about VMware Cloud Provider Hub using links below

