In Part 1 of this series we looked at the challenges facing Analytics workloads, the potential need for GPU based relational databases and the setup of the validation environment. In this part we will look at the results from the validation of the vSphere virtualized SQream Database for data loading and querying.
DB Data Loading performance validation
Contents
One of the key aspects that affects the performance of the database is the time to load the data into the database. We loaded the data with a chunk size of 10 MB, which is used for GPUs with good amount of memory like the Tesla P100.
Data Loading for 10 TB with Chunk size of 10 MB:

Table 3: Data loading comparison for 10 MB chunk size
Highlights of the 10 MB Chunk Size Data Load:
- Total resulting cluster size – 2.8 TB, after SQream DB on-the-fly compression during ingest
- Compression ratio ~ 1:3.75
- Loading time – 4h15m total, average 2.47 TB/h, or 686 MB/s
Loading summary
- Loading on the Fibrechannel VMware drives was consistently good, with read/write combination rates averaging ~2.5 TB/h with SQream DB.
- No optimizations were used for loading data. The system is a stock configuration.
- Independent storage tests with utilities like FIO have shown read bandwidth to be 2,130
- MB/s and write bandwidth to be 1,777 MB/s, which leaves room for SQream DB to grow in multi-GPU environments.
- Typical loading throughput for bare metal servers with fast SSD storage in RAID5 configuration is around 1.5TB/h – 2.2TB/h. Some converged appliances can reach a similar 2.5TB/h with fast NVMe storage.
- As such, the VMware platform with Fibrechannel storage provided results comparable to other bare metal solutions tested earlier.
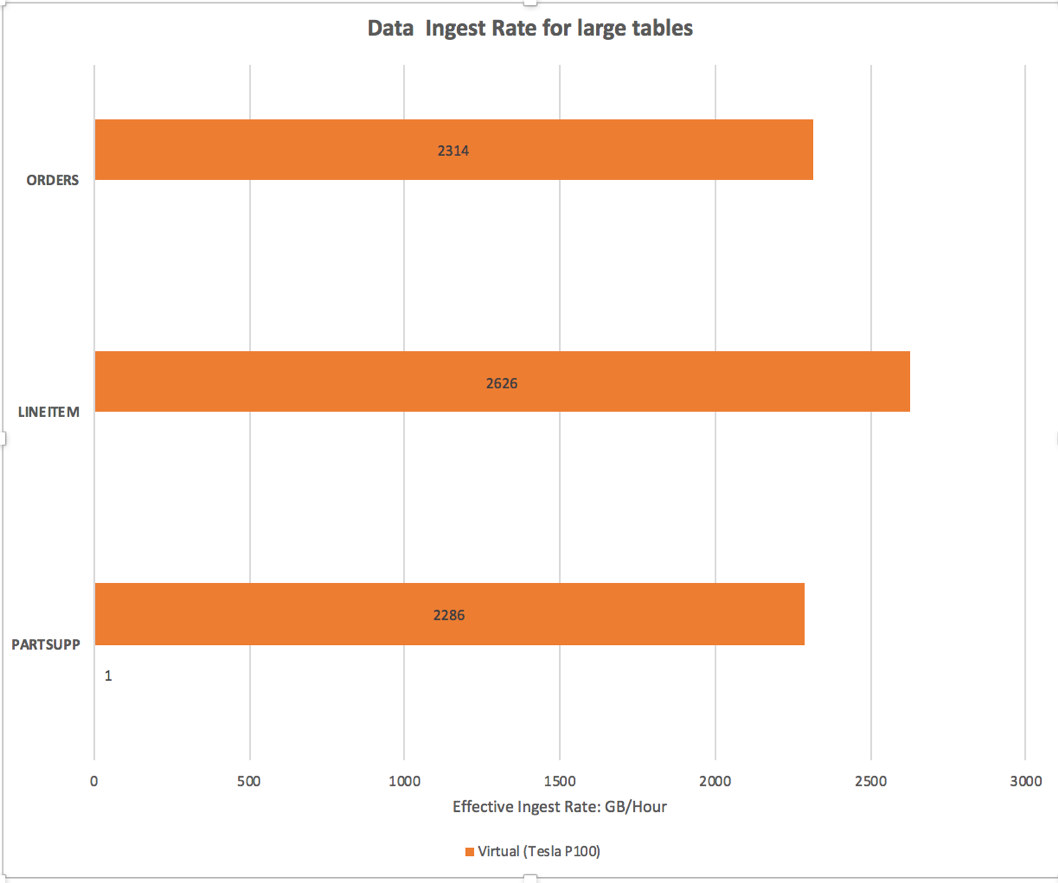
Figure 3: Data Ingest rate for large tables
The chart shows that the ingest rate on the vSphere environment is very good and is comparable to existing metrics in bare metal environments.
Querying
The components of TPC-H consist of eight separate and individual tables (the Base Tables). The relationships between columns in these tables are illustrated in the following ER diagram:
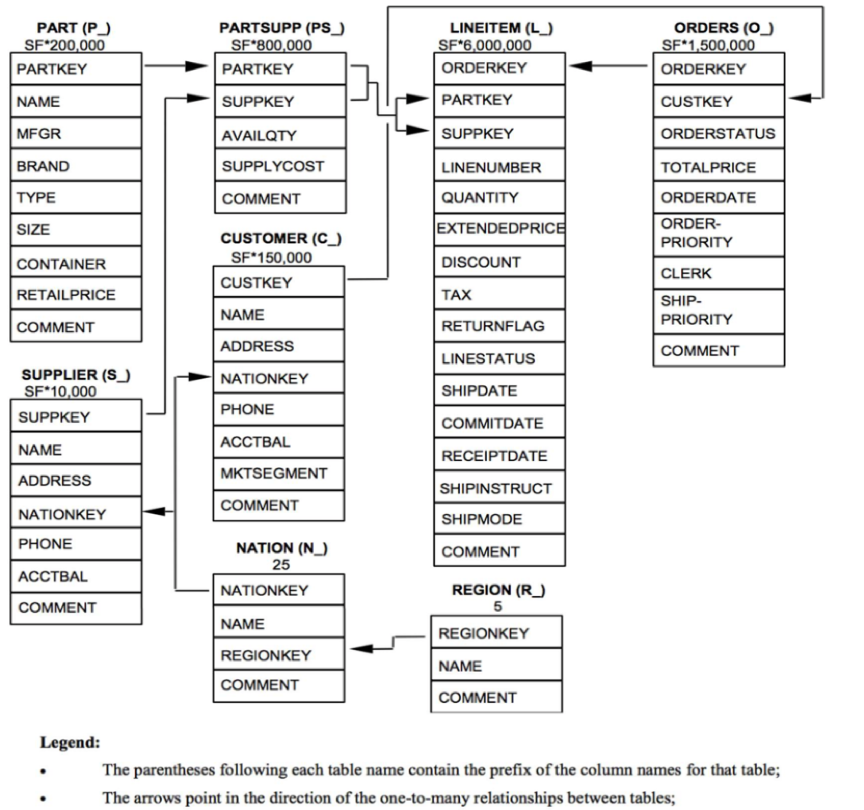
Figure 4: TPC-H Table components
Each TPC-H query asks a business question and includes the corresponding query to answer the question
Queries
TPC-H comes with a set of packaged queries that can used for validating a data analytics environment. We chose three of the queries for our validation. The queries themselves are listed in Appendix A. Below is a description of these queries.
Q1: Pricing Summary Report Query
This query reports the amount of business that was billed, shipped, and returned.
The Pricing Summary Report Query provides a summary pricing report for all line items shipped as of a given date. The date is within 60-120 days of the greatest ship date contained in the database.
The query lists totals for extended price, discounted extended price, discounted extended price plus tax, average quantity, average extended price, and average discount. These aggregates are grouped by RETURNFLAG and LINESTATUS, and listed in ascending order of RETURNFLAG and LINESTATUS. This query is heavily compute-bound.
Q8 – National Market Share Query
This query determines how the market share of a given nation within a given region has changed over two years for a given part type.
The market share for a given nation within a given region is defined as the fraction of the revenue, the sum of [l_extendedprice * (1-l_discount)], from the products of a specified type in that region that was supplied by suppliers from the given nation.
The query determines this for the years 1995 and 1996 presented in this order. This query is partially I/O bound compute-bound.
Q19 – Discounted Revenue Query
The Discounted Revenue Query reports the gross discounted revenue attributed to the sale of selected parts handled in a particular manner. This query is an example of code such as might be produced programmatically by a data mining tool.
The Discounted Revenue query finds the gross discounted revenue for all orders for three different types
of parts that were shipped by air and delivered in person. Parts are selected based on the combination of specific brands, a list of containers, and a range of sizes. This query is heavily I/O bound. It reads a lot of data in a “random” manner.
Results
TPC-H Query Performance:
The three queries mentioned were then run on the virtual SQream DB instances. The query throughput performed well and the query throughput shown in the charts below compares well to similar bare metal systems.
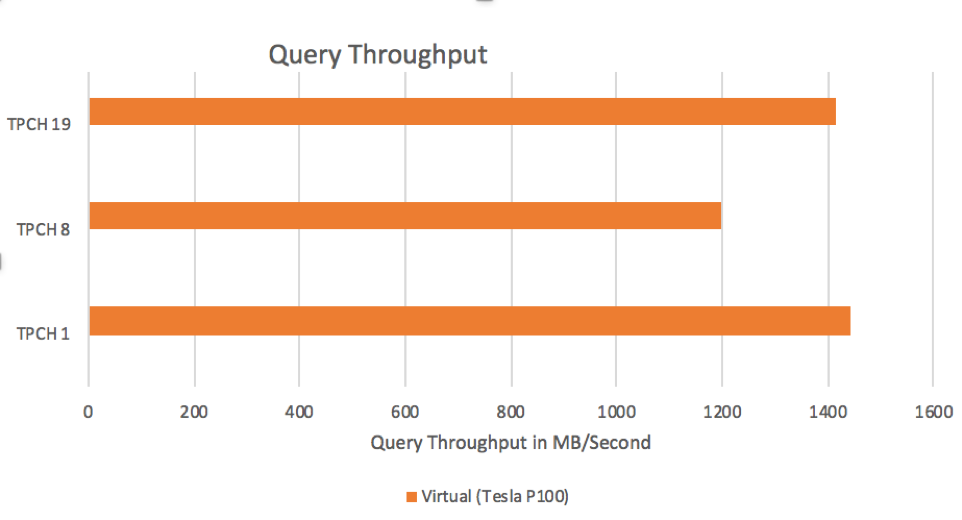
Figure 5: Query Throughput
FIO Storage Performance Validation:
Our experiment was supplemented with FIO (Flexible I/O Synthetic Benchmark) testing to validate the storage infrastructure in the virtual environment. The results were very consistent and comparable to bare metal environments (~2.1GB/s for Reads, 1.7GB/s for Writes).
FIO Testing Run:
|
[SQream@SQreamdb01 ~]$ sudo fio —randrepeat=1 —ioengine=libaio —direct=1 — gtod_reduce=1 —name=test —filename=/gpu_data2/test$jobnum.file —bs=32k —iodepth=64 — size=20G —numjobs=8 —readwrite=randread —rwmixread=100 |
|
1 2 3 4 5 6 7 8 9 10 11 12 13 14 15 16 17 18 19 20 21 22 23 24 25 26 27 28 29 30 31 32 33 34 35 36 37 38 39 40 41 42 43 44 45 |
test: (g=0): rw=randread, bs=(R) 32.0KiB–32.0KiB, (W) 32.0KiB–32.0KiB, (T) 32.0KiB– 32.0KiB, ioengine=libaio, iodepth=64 fio–3.1 Starting 8 processes test: Laying out IO file (1 file / 20480MiB) Jobs: 8 (f=8) ... Run status group 0 (all jobs): READ: bw=2033MiB/s (2131MB/s), 254MiB/s–256MiB/s (266MB/s–268MB/s), io=160GiB (172GB), run=79989–80604msec Disk stats (read/write): sdc: ios=5239452/7, merge=0/1, ticks=12651988/21, in_queue=12675697, util=100.00% [SQream@SQreamdb01 ~]$ sudo fio —randrepeat=1 —ioengine=libaio —direct=1 — gtod_reduce=1 —name=test —filename=/gpu_data2/test_new$jobnum.file —bs=32k — iodepth=64 —size=20G —numjobs=8 —readwrite=randwrite —rwmixwrite=100 test: (g=0): rw=randwrite, bs=(R) 32.0KiB–32.0KiB, (W) 32.0KiB–32.0KiB, (T) 32.0KiB– 32.0KiB, ioengine=libaio, iodepth=64 ... fio–3.1 Starting 8 processes test: Laying out IO file (1 file / 20480MiB) Jobs: 8 (f=8): ... Run status group 0 (all jobs): WRITE: bw=1694MiB/s (1777MB/s), 212MiB/s–212MiB/s (222MB/s–222MB/s), io=160GiB (172GB), run=96612–96692msec Disk stats (read/write): sdc: ios=0/5238752, merge=0/1, ticks=0/5039148, in_queue=5044816, util=99.73% |
Summary
vSphere’s support for the latest HW advancements in computing makes it a great platform for new GPU accelerated databases. GPU accelerated databases like SQream DB can be used to keep up with the exponentially growing needs for high-performance real-time data analytics. The Virtualized SQream DB solution was successfully validated through TPC-H to be a viable and robust solution. The results clearly show that virtualized GPU databases can perform well on vSphere. Virtualized GPU Databases can benefit from all the capabilities such as high availability, load balancing, disaster recovery, agility, etc. of the vSphere platform that are lacking in bare metal environments.


