Rightsizing a Machine Learning Cluster on VMware vSphere
Contents
In part 1 of this 2-part article, we saw multiple applications running on Apache Spark clusters, the TensorFlow runtime, Cloudera CDH platform and other workloads – all sharing a set of physical servers that were managed by VMware vSphere. These applications operate in collections of virtual machines that were set up for different purposes in the machine learning lab. These collections, known in VMware terminology as “resource pools”, allowed the different projects to run in parallel while not dedicating hardware specifically to them.
One of the workloads we explore more deeply in part 2 is a machine learning training and testing sequence. We are interested in scaling this up or down to find the best Spark cluster configuration to handle the quantity of data that it was dealing with. The training data here is made up of one million examples and ten thousand features, but further tests were conducted with higher data volumes using the same model also. The original data size did not require the power of GPUs to train the model on it, although the use of GPUs with virtual machines is also available on vSphere. For more on that subject, check out this blog article and this guide
The Spark outline architecture is shown in Figure 1. In this case, the team used the default cluster manager that is built into standalone Spark itself, as the system was required to be as lightweight as possible, mainly for developer/data scientist use. The same Spark environment can also operate in the context of a YARN cluster manager as you would find in a Hadoop setup – and we did that using Cloudera CDH as a separate exercise. For this article, we concentrate on using the standalone form of Spark.
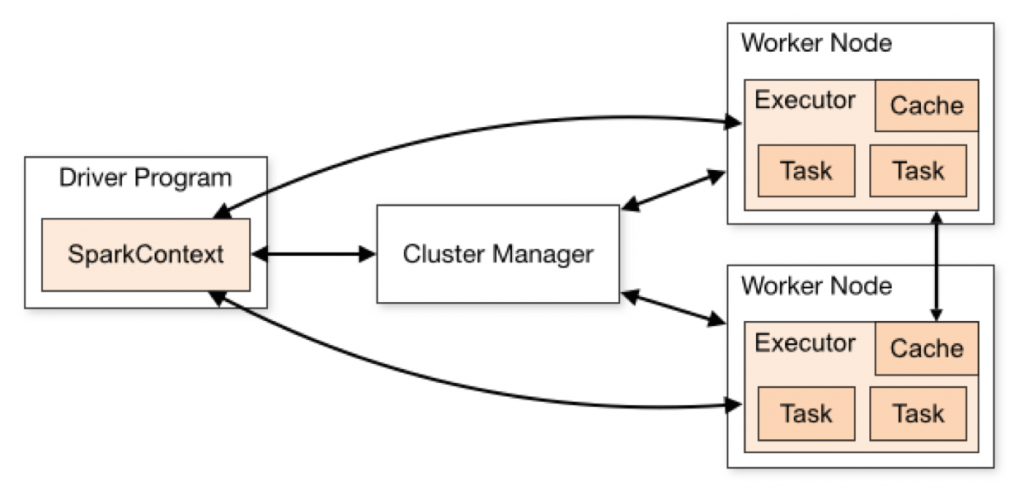
Figure 1: The Spark outline architecture that supports the MLlib library for machine learning
When given a model by a data scientist, a data engineer engages in a cluster sizing activity in order to prove that the model execution operates best on new test data with a certain cluster size. Ideally, the test data would not have been seen before in this model execution, so as to avoid the known issue of “over-fitting”. By installing Spark just once and then scaling up the cluster through vSphere’s cloning of worker virtual machines, we can create clusters of different sizes very quickly. With that facility, we were able to show that an optimal cluster size for this particular ML application and dataset contains a particular number of virtual machines with certain executor parameters set (number of cores, number of executors, executor memory).
A Use Case in Virtualizing Machine Learning: Right-Sizing an ML Cluster for Best Performance
In our early work with the Spark MLlib library, we wanted to find an optimal standalone Spark cluster configuration for the deployment of a machine learning/logistic regression training exercise on a certain quantity of data. From a performance point of view, this particular system was measured by the time taken for model training as well as the wall clock time (“real” time) for a full test, including the spin-up of the Spark processes on each virtual machine. The idea was to make life easier for the data scientist to be able to repeat these tests very rapidly to get to the best configuration of the model, with a clean cluster configuration each time.
Our cluster is made up of nodes or Spark workers that are running in virtual machines. The Spark Jar files and invocation scripts, along with the Spark-perf test software suite are installed into the virtual machines’ guest operating systems – in the same way as they would be on physical machine. There were no special actions or changes need for installing everything into virtual machines. We used standalone Spark for this testing, mainly because it was easy to download and install from the Apache Spark web pages. We also used Spark as embedded within the Cloudera Distribution including Hadoop (CDH) product for similar ML tests.
The test suite used for this purpose was a “Spark Perf” set of programs that is available in Github here
Testing with Different Configurations
We started the cluster sizing exercise with a smaller collection of four Spark worker node virtual machines. We then ran a machine learning test program from the Spark Perf suite that trains a logistic regression model on a particular dataset and then executes some tests against it. We first ran this test sequence on a small set of virtual machines hosted on three HPE DL380 Gen 8 virtualized host servers with just 128GB of physical memory each in our vSphere datacenter. When that initial “smoke test” finished, we found that a key performance measure we were interested in, the wall clock time to complete the work, was in the range of 40-42 minutes. This was deemed to be unacceptable for the daily work of a data scientist, who wants to have as rapid turnaround time as possible in their tests. The data scientists want to iterate on tuning their ML model within 4-5 minutes, if possible. For bigger data sets, this turnaround time would be longer, we understood, but the initial dataset was taken as the yardstick for measurement.
We first moved the set of virtual machines to a newer VMware environment with four newer host servers, where the hardware was more recent and more powerful, without changing the number of worker virtual machines. On this second setup, our result for the same test with four equivalent virtual machines was a wall clock time of 18 minutes, 11 seconds, a good improvement, but not ideal as yet.
With this new setup, a key performance measurement, the ML model training time was 795.234 seconds. This result is shown in Figure 2. The model training time is seen at four lines down from the top of the output shown. You can see the four Spark Worker processes being stopped at the end of the single test run, with one Worker per virtual machine. We could also choose to run more than one Worker in a virtual machine, but we kept it simple here. We should note that the overall wall clock time (shown as “real” at three lines from the bottom of Figure 1) includes time for the Spark process spin-up and spin-down time across each of the worker virtual machines, not just the model training and test execution times. This is an example of a “transient” Spark cluster in use, where all Worker processes were stopped at the end of the test run. The virtual machines can optionally live on past the lifetime of the Spark cluster or be brought down after each test also, using a scripted method.
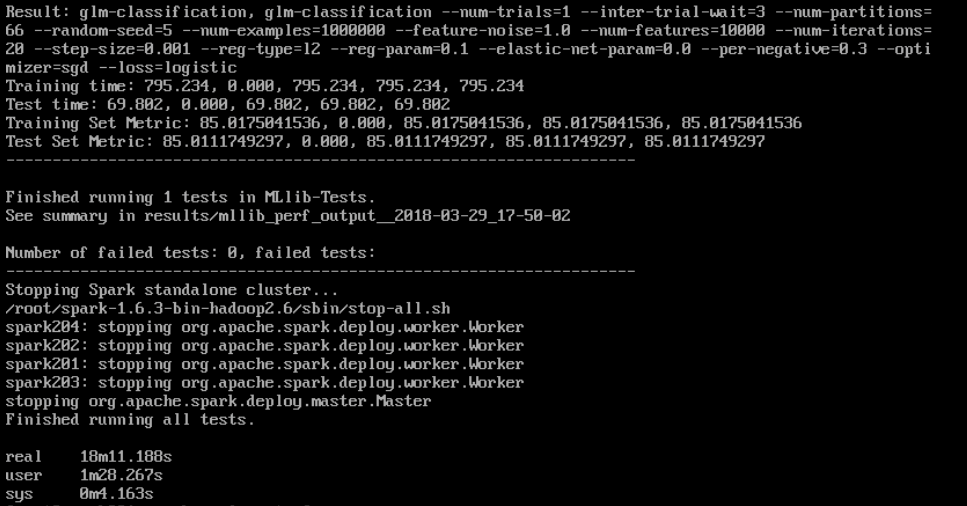
Figure 2: Model training time (the 4th line from the top) and wall (real) test completion time with a cluster deployed in four virtual machines
The 18.11 minutes of total wall clock time for test completion was still considered to be too slow to satisfy the data scientist. To improve these results, we gradually built up the number of worker virtual machines (and so the total number executor processes within them) that were participants as workers in the Spark cluster. These worker virtual machines had portions of the full job distributed to them by the main or “driver” virtual machine.
By continuing to clone new virtual machines using the vSphere Client user interface and adding them to the Spark cluster, we found that the wall clock completion time and training time improved, such that with 11 worker virtual machines in the cluster, including a worker process in the Spark driver virtual machine, the training time reduced to 21.735 seconds. For that test run, the wall clock completion (“real”) time was 2 minutes 16.506 seconds. This distinct improvement in the training time is shown in Figure 3 below. Adding new workers to the Spark cluster was a very simple process.
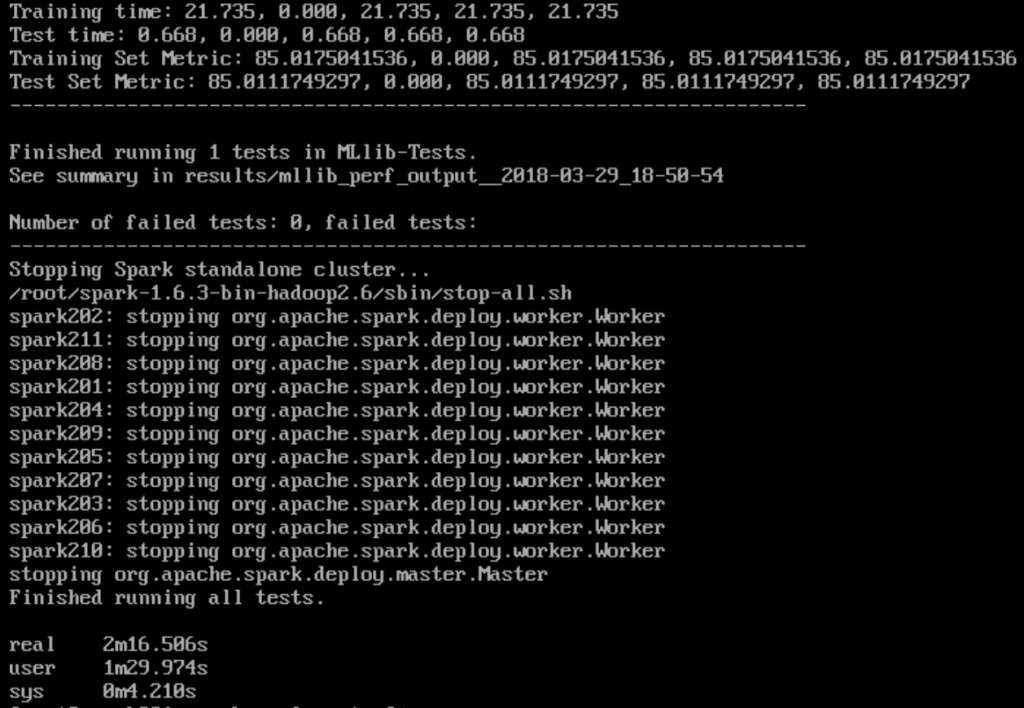
Figure 3: Model training time shown in the top line of the output along with the wall clock completion time (shown as “real” near the bottom) for the test
We added in new Spark worker processes to the cluster simply by adding the new virtual machine’s hostname into the list of entries in the $SPARK_HOME/conf/slaves file. The Spark cluster was then restarted, using the start-master and start-slaves shell scripts, as is the normal procedure with standalone Spark clusters.
When we looked closely at the Spark console for the 11 worker runs, we saw that there were 3 Spark executors (that is, “ExecutorBackend” Java processes) per virtual machine (i.e. per Spark worker process). The default system setup applied, such that a single virtual machine contained one Spark worker process. The worker process is itself responsible for starting the three Spark executors that carry out the real work for that virtual machine .
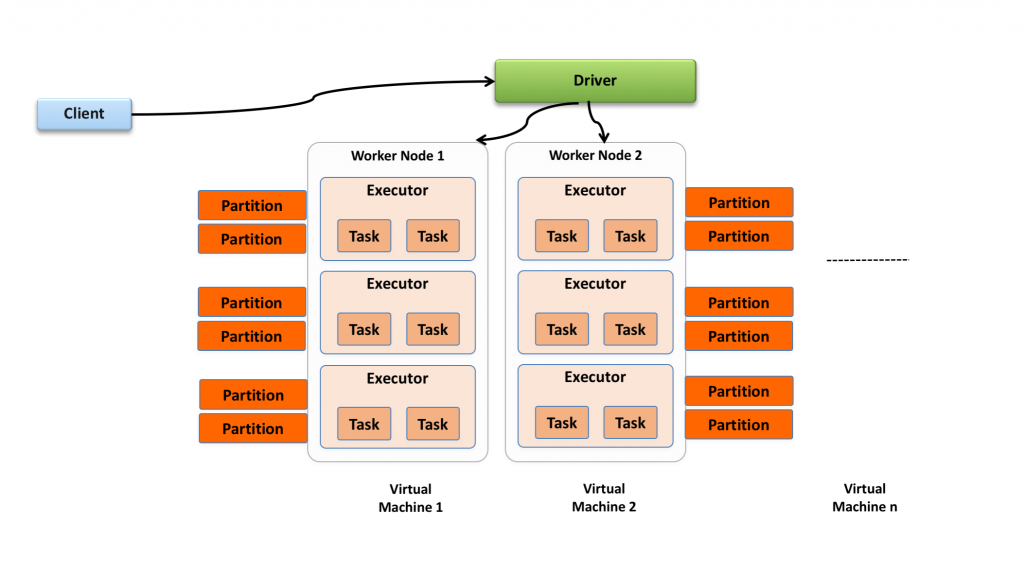
Figure 4: Mapping of Spark executors to worker virtual machines and executor cores/tasks to data partitions (1:1)
Finding the Optimal Setup
The number of Spark executor processes per virtual machine was decided by the Spark scheduler at cluster start time, based on the amount of memory and virtual CPUs allocated to that Spark worker node (i.e. to the virtual machine).
We allocated 2 cores and 4GB of memory to each executor in the appropriate Spark Perf configuration file (a Python file in the “config” directory). This resulted in the Spark scheduler allocating 3 executor processes per worker node virtual machine, since each VM had 6 vCPUs and enough memory to cover the 3 executors’ needs. The executors are shown in Figure 4, along with the two tasks they could execute. Each core would have one task executing on it at any one time. Tasks are the units that do the real work and they can run in parallel within Spark.
We concluded that when the total number of total cores (i.e. the number of tasks) used by the Spark executors matched the total number of specified data partitions, then the system was optimally configured to produce the best completion time and training time result. The partitions are segments of a resilient distributed dataset that are distributed to different nodes in Spark. We found this through experimenting with cluster sizing and values for the executors and partitions. We saw further improvements when we retained that matching algorithm with higher numbers of virtual machines and partitions.
It would have been much more difficult to find these numbers with a physical implementation, where each new Spark worker may require a server machine of its own! This showed a distinct advantage of using virtualization for this kind of sizing/tuning and model testing work in the machine learning lab. This same exercise would be carried out by a data engineer who is in the process of making the cluster ready for production.
Cluster Creation
We installed the Spark software into a single “golden master” virtual machine at the outset. Using the rapid cloning and ease of configuration changes to virtual machines (number of vCPUs, amount of memory) in vSphere allowed us to change cluster sizing easily and then decide what the best configuration for our cluster for this particular dataset-model testing would be.
Conclusion
This article describes the benefits of using the VMware vSphere virtualization platform for testing and deployment of machine learning applications, both in the lab and in getting them ready for production. We saw in Part 1 that the many different versions of the machine learning platforms, such as Spark, Python, TensorFlow and others is better handled for concurrent operation in virtualized form. We also see in Part 2 that experimentation with scaling a cluster of worker instances to reach the sweet spot in performance is more easily achieved through use of virtual machines. Finally, we conclude that rapid cloning of workers in a cluster allows the architect to scale-out or scale-in their cluster over time in quick order, leading to better prototyping and readiness testing time.
These are all advantages that are seen by the data science and machine learning practitioner through the use of virtualization, using VMware vSphere.


