This post originally appeared on Clouds, etc. by Daniel Paluszek.
This is a continuation of VMware vCloud Usage Meter 3.6.0.1 – End to End Deployment and Configuration (2 of 3)
Part 1 here
Part 2 here
Verifying and Configuring vCloud Usage Meter Data Collection
Contents
-
- Alright, home stretch!
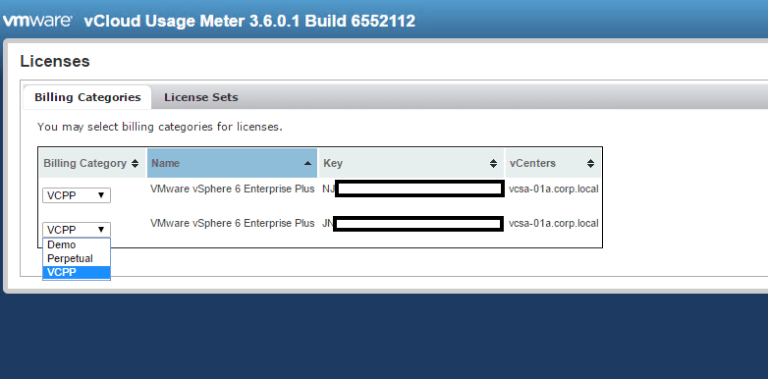
- Click Licenses at the top right corner – let’s verify the connected vCenter licenses are shown as VCPP. By default, they will be imported as VCPP. If you have any Perpetual licenses connected to the monitored vCenter, it is important you classify it as such. Any VCPP MUST be classified as VCPP under the licenses.
-
- Let’s go to the Monitor tab – this shows how many collections have happened – you want to see 24 on a daily basis (1 an hour). If there’s not, there’s an issue. (Ignore my Day 10 – that’s when I changed my time from UTC to EST 🙂 ).

- Let’s go to the Monitor tab – this shows how many collections have happened – you want to see 24 on a daily basis (1 an hour). If there’s not, there’s an issue. (Ignore my Day 10 – that’s when I changed my time from UTC to EST 🙂 ).
- Now we are going to create two new Customers (think tenants) that will be part of my itemized billing. What’s great about Usage Meter is we can provide granular reporting based on tenant usage – a roll-up of how many points a Customer uses on a monthly basis. Usage Meter is not intended for customer-facing chargeback, but more for compliance between the Provider and VMware – this is a nice addition that definitely helps out the provider.
- Note – if you are setting up Usage Meter for entire data center collection, Customer setup is optional. By default, Usage Meter will pull the entire environment into the Monthly Reports. The following steps can be skipped.
Customer/Rules Setup and Walkthrough
-
- Click on the Customers link at the top right corner. By default, no customers are added by vCenter connections – however, vCloud Director will import any Orgs and assign them based on their respective org VDC (think Resource Pool) – very nice option!

- Click on the Customers link at the top right corner. By default, no customers are added by vCenter connections – however, vCloud Director will import any Orgs and assign them based on their respective org VDC (think Resource Pool) – very nice option!
-
- I’m going to go ahead and establish a new customer called “Tenant” – click on the Add button and provide the name, Country (note to my fellow US citizens – US is fifteen down from the top, not in alphabetical order), and zip code. If you want to anonymize this customer data, click the box Restricted.
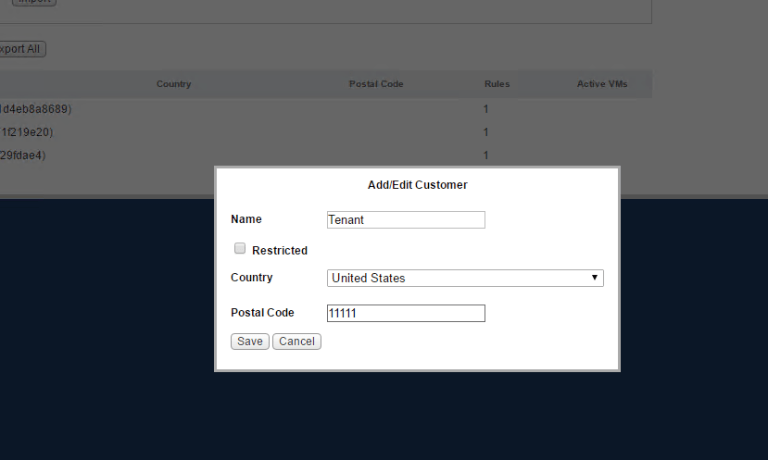
- I’m going to go ahead and establish a new customer called “Tenant” – click on the Add button and provide the name, Country (note to my fellow US citizens – US is fifteen down from the top, not in alphabetical order), and zip code. If you want to anonymize this customer data, click the box Restricted.
-
- We can now see Tenant in the Customer list, but no rules or VM’s attached to it. Do you also see how now we have Active VM’s attached to the Public, T1, and T2 Customers? This is because UM detected those Org, assigned the rule, and is collecting data – slick!
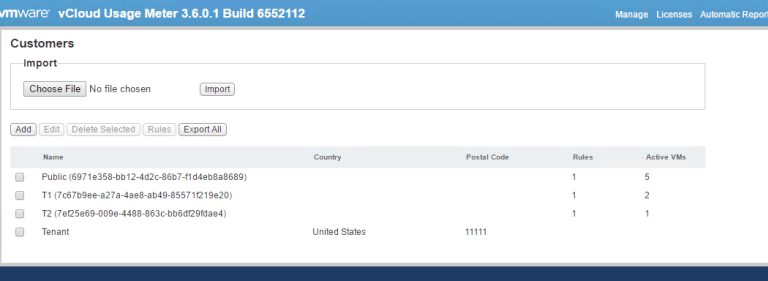
- We can now see Tenant in the Customer list, but no rules or VM’s attached to it. Do you also see how now we have Active VM’s attached to the Public, T1, and T2 Customers? This is because UM detected those Org, assigned the rule, and is collecting data – slick!
-
- OK – let’s click on Rules now on the top right corner.
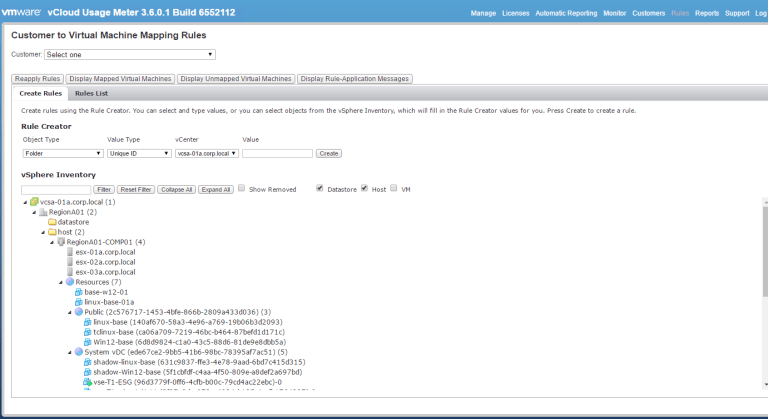
- OK – let’s click on Rules now on the top right corner.
-
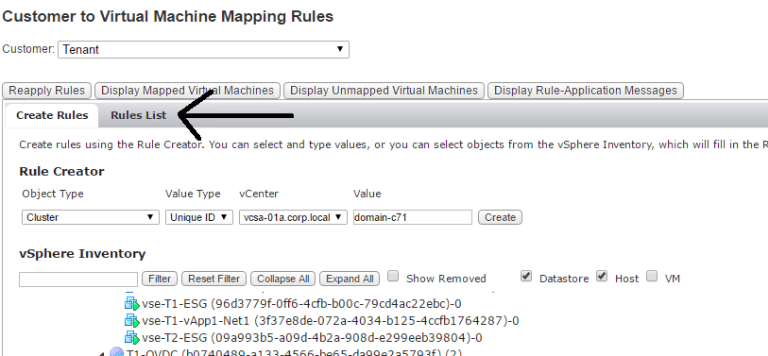
- Before we create a rule for Tenant, let’s check out the existing vCD rules that were automatically created. Click on Rules List –
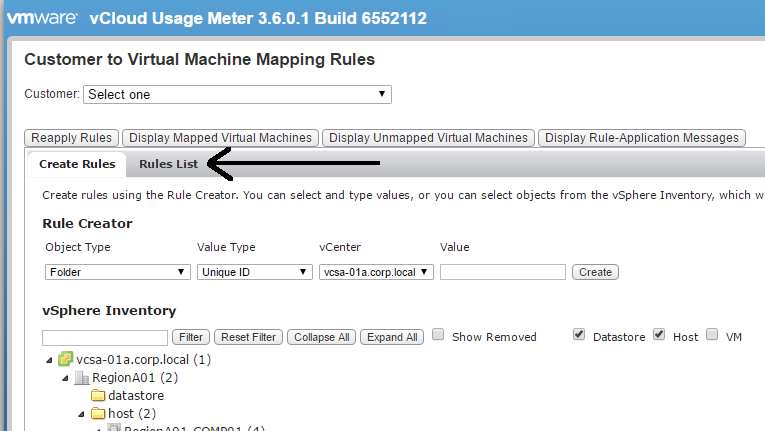
- Before we create a rule for Tenant, let’s check out the existing vCD rules that were automatically created. Click on Rules List –
-
- From here, we can see how the Rule was applied – there’s an exact string applied for each Org/Customer.
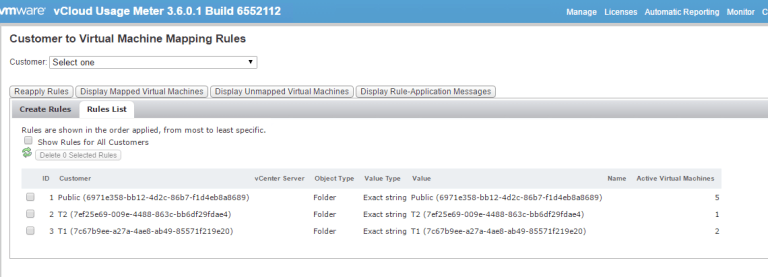
- From here, we can see how the Rule was applied – there’s an exact string applied for each Org/Customer.
-
- Now let’s check out which VM’s are under Public – click the Customer list at the top and select Public

- Now let’s check out which VM’s are under Public – click the Customer list at the top and select Public
-
- You can also see the list has changed – I see the only Public rule applied. From here, I can click Display Mapped Virtual Machines
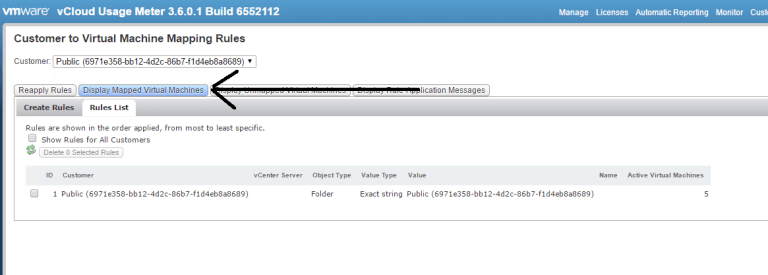
- You can also see the list has changed – I see the only Public rule applied. From here, I can click Display Mapped Virtual Machines
-
- Now we can see the mapped VM’s to Public – this is a great way of verifying if you rule is setup the way you want it.

- Now we can see the mapped VM’s to Public – this is a great way of verifying if you rule is setup the way you want it.
-
- Okay, back to setting up Tenant for collection. Press Back or Click on Rules at the top and select the Customer drop-down – Tenant. From here, we will be creating a rule that maps to my Management cluster for this demonstration. Remember, you can create rules that are associated with an entire Data Center, Cluster, Resource Pool, Folder, prefix, etc – many options are available.
- Note – if you look at my screenshot below, I deployed Usage Meter to my Management Cluster. Where is it? 🙂 We automatically remove Usage Meter from any data collection – you do not pay for any resource usage for the UM appliance.
- I selected the RegionA01-MGMT01 object and we can see the Rule Creator it automatically changed the Object Type Cluster and has a specific value. This value matches to how vCenter sees the cluster in the MOB browser. In my example, I have “domain-c71”
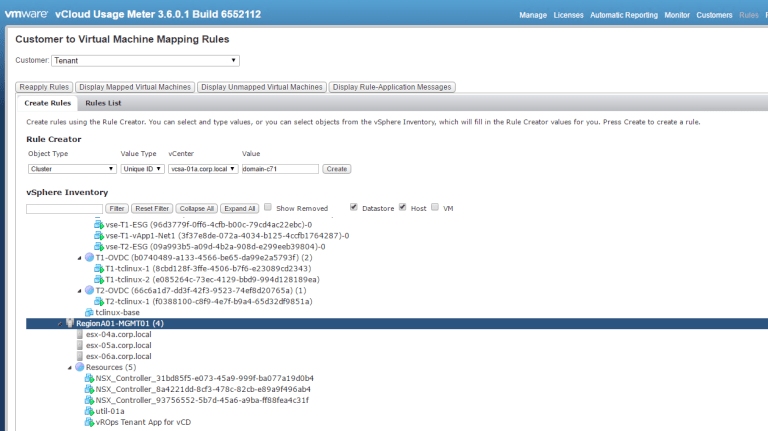
- Okay, back to setting up Tenant for collection. Press Back or Click on Rules at the top and select the Customer drop-down – Tenant. From here, we will be creating a rule that maps to my Management cluster for this demonstration. Remember, you can create rules that are associated with an entire Data Center, Cluster, Resource Pool, Folder, prefix, etc – many options are available.
-
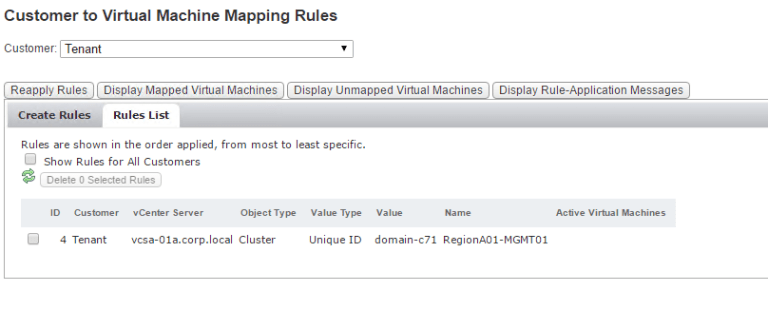
- When you’re ready to create the rule – click Create on the Rule Creator section. Once it’s created, the Rules List sublink will blink Yellow, and let’s go ahead and click that.
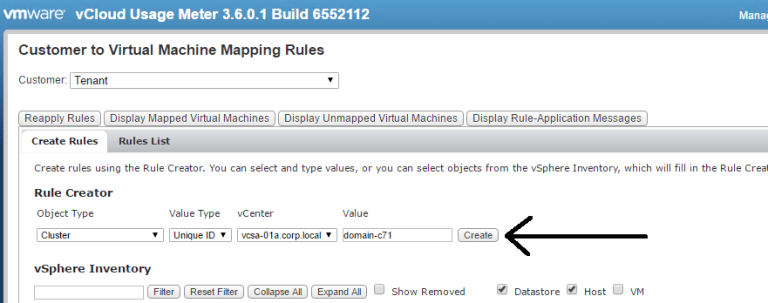
- When you’re ready to create the rule – click Create on the Rule Creator section. Once it’s created, the Rules List sublink will blink Yellow, and let’s go ahead and click that.
- Excellent, we see our new rule populated. Note – Active VM’s will not show until the next monitoring interval. By default, it runs 5 minutes past the hour.
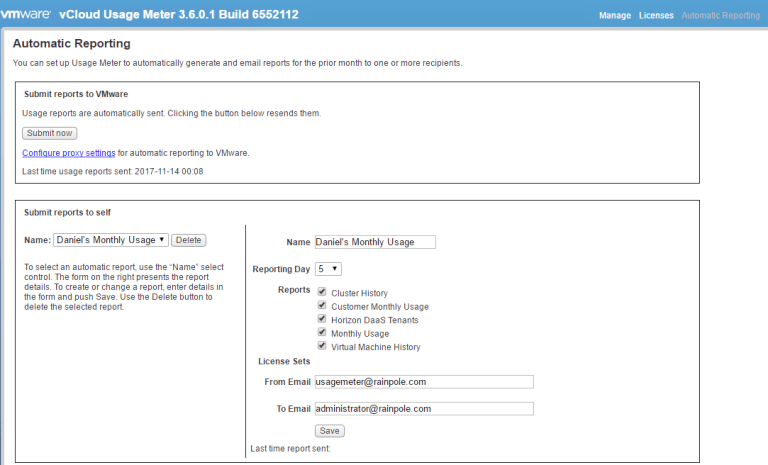
Automatic Reporting Tab
Here’s where you can set up automatic monthly reporting to a specific email address outside of your point of contact. Currently, this DOES NOT send your usage results to VMware or the iAsset portal. You still need to input your monthly usage by the 5th of every month.
I configured where I wanted to send this when to send this – pretty straightforward.
Monthly Report Walkthrough
-
- Let’s go ahead and click on Reports in the top right corner.
- By default, the monthly reports will be emailed to the point of contact identified in the setup. There are five different reports:
- Customer Monthly Usage
- Horizon DaaS Tenants
- Monthly Usage
- Cluster History
- Virtual Machine History

-
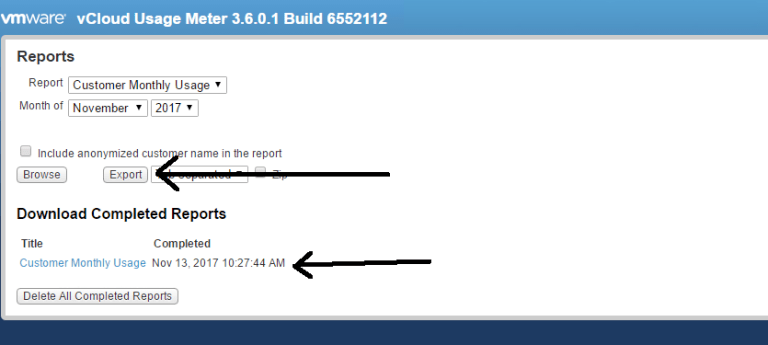
- Basic functions – you can either Browse or Export the reports. Browse will show on the screen while Export will turn the report into a TSV file for you to download. The latter is the required item for compliance.
- Basic functions – you can either Browse or Export the reports. Browse will show on the screen while Export will turn the report into a TSV file for you to download. The latter is the required item for compliance.
-
- Monthly Usage
- This report shows the entire aggregate of what Usage Meter sees. How many points on each bundle Usage Meter has collected, vSAN usage, VM’s by Product Server, and vCD Summary. If we had Horizon DaaS, it would show up here.
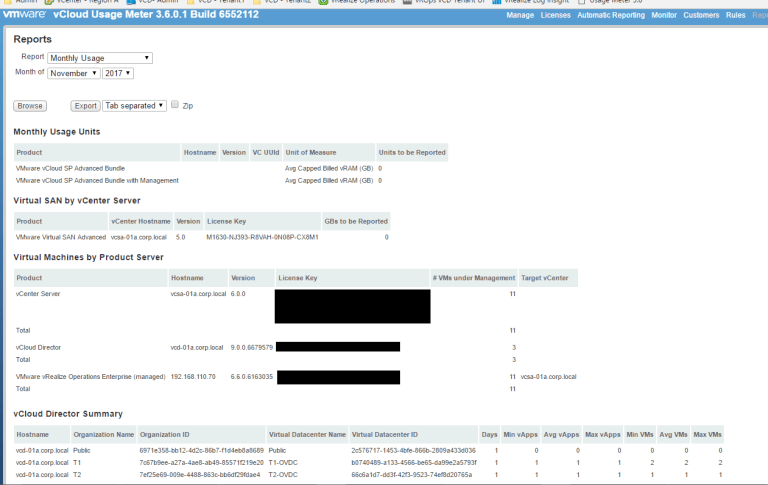
- This report shows the entire aggregate of what Usage Meter sees. How many points on each bundle Usage Meter has collected, vSAN usage, VM’s by Product Server, and vCD Summary. If we had Horizon DaaS, it would show up here.
- Monthly Usage
-
- Customer Monthly Usage
- This shows what each Customer uses on a monthly basis along with the respective bundle. Since we just started the collection, I don’t have any data here but we can see the Customers inside of the Monthly Usage section.
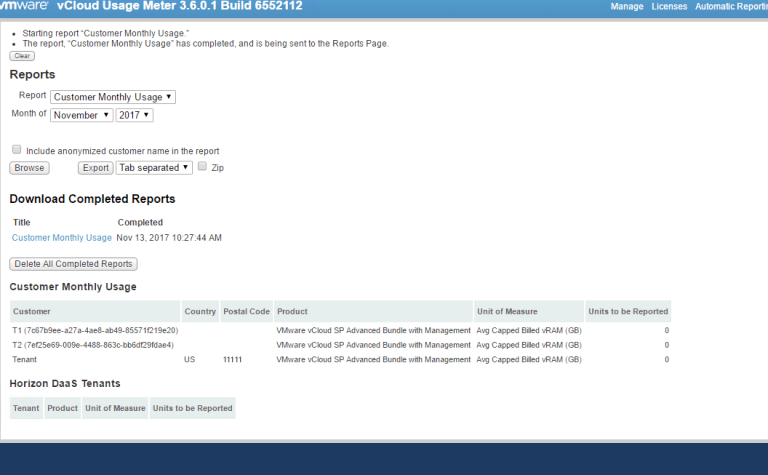
- This shows what each Customer uses on a monthly basis along with the respective bundle. Since we just started the collection, I don’t have any data here but we can see the Customers inside of the Monthly Usage section.
- Customer Monthly Usage
-
- Virtual Machine History
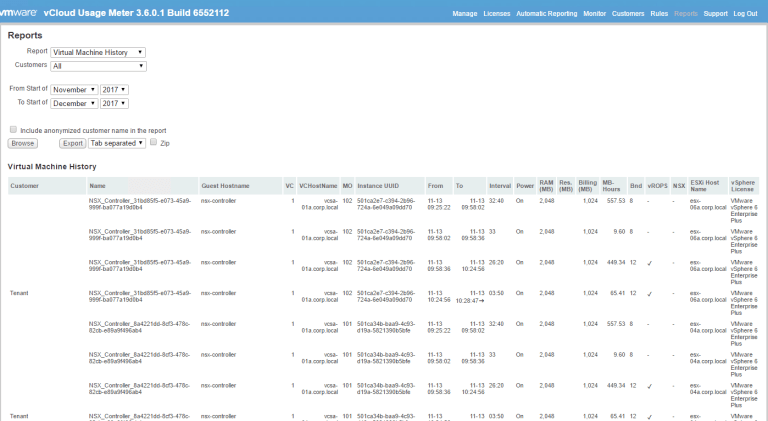
- This is a great report for getting initial estimates of what an environment could utilize in the VCPP program – this is the report that I use to provide estimates.
- The VM History report shows the VM state, allocated vRAM, and then Billed vRAM – that’s where sizing estimates come into play.
- Virtual Machine History
- Cluster History
- This report is used for vSAN – shows usage based on vSAN storage on disk along with any features that may be applied. For example, my COMP01 cluster has DeDuplication turned on. This requires an Enterprise licensed so we see it applied.
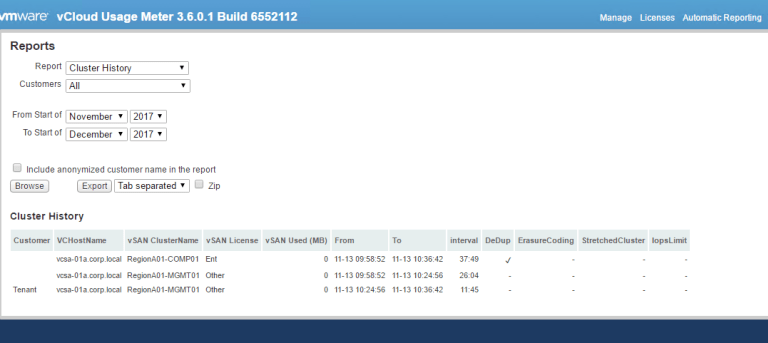
- This report is used for vSAN – shows usage based on vSAN storage on disk along with any features that may be applied. For example, my COMP01 cluster has DeDuplication turned on. This requires an Enterprise licensed so we see it applied.
Monthly Report Collection
-
- Okay, let’s go ahead and export all of the reports – this is a good example of what you would send to your aggregator for monthly billing.
- Click on Reports at the top and then hit the Export button for each report.
- From here, we will see the reports under the Download Completed Reports
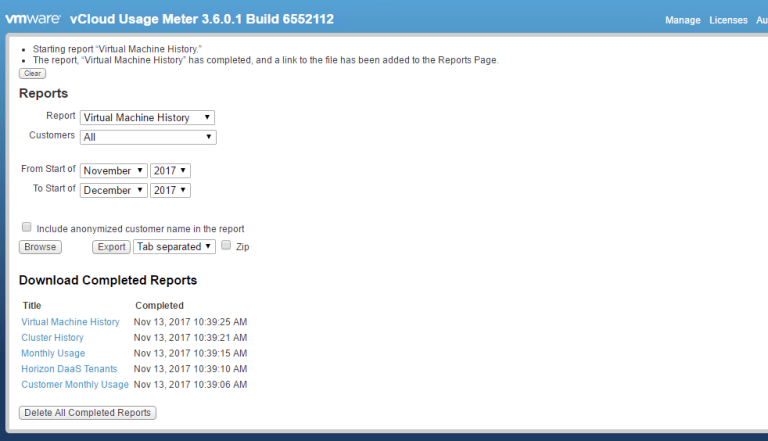
- They are TSV files – so can be opened with Excel or a notepad editor. As you can see, they are all tab separated, so the data can be reviewed as such.
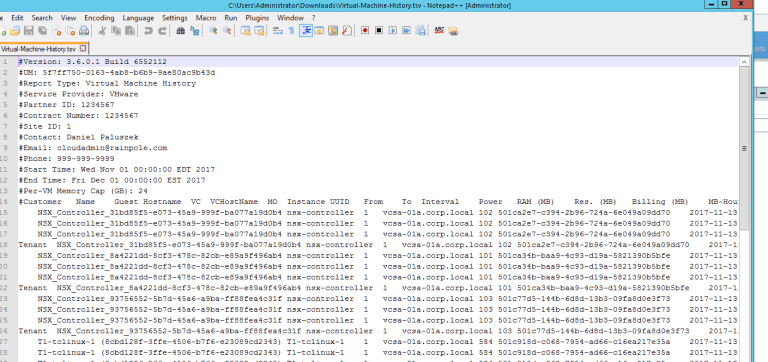
Note – any changes to this file will change the MD5 hash – DO NOT make any modifications!
That’s it! I realize this series was lengthy, but it’s good for our existing and up and coming providers to understand Usage Meter setup and what I’ve learned in my time working with it. More to come!
Stay tuned to the VMware Cloud Provider Blog for future updates, and be sure to follow @VMwareCloudPrvd on Twitter and ‘like’ us on Facebook.

