Update 1.50.1: The update addresses these issues.
Downloads: Windows: User System ARM | Mac | Linux: snap deb rpm tarball ARM
Welcome to the September 2020 release of Visual Studio Code. There are a number of updates in this version that we hope you will like, some of the key highlights include:
If you’d like to read these release notes online, go to Updates on code.visualstudio.com.
Join us live at the VS Code team’s livestream on Tuesday, October 13 at 8am Pacific (4pm London), to see a demo of what’s new in this release and ask us questions live.
Insiders: Want to try new features as soon as possible? You can download the nightly Insiders build and try the latest updates as soon as they are available.
macOS: Keychain access moved to a different process
Contents
- 1 macOS: Keychain access moved to a different process
- 2 Accessibility
- 3 Workbench
- 4 Editor
- 5 Debugging
- 6 Source Control
- 7 Terminal
- 8 Preview features
- 9 Contributions to extensions
- 10 Extension authoring
- 11 Proposed extension APIs
- 12 Debug Adapter Protocol
- 13 Engineering
- 14 Documentation
- 15 Notable fixes
- 16 Partner extensions
- 17 Thank you
Some changes in this release around how the macOS Keychain is accessed from VS Code will require you to acknowledge the following prompt for keychain access on macOS, even if you’ve previously allowed keychain access:
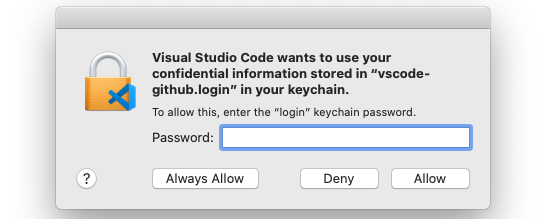
Details: VS Code previously accessed the macOS keychain from the window process itself, but now accesses it from the main process. As such, for macOS it prompts for approval like a new application is requesting access, because the process is a different one from before.
Accessibility
Settings editor
Back in July, we mentioned in the 1.48 release notes that we were investigating ways to improve the accessibility of the settings editor. After a few months of talking to screen reader users, experimenting, prototyping, and gathering feedback from the community, we are shipping the new experience, which we believe is an improvement for all keyboard-heavy users, whether using a screen reader or not.
In this new interaction model, interacting with the settings list works more like interacting with any other list in VS Code. With focus in the search bar, you can press the down arrow to focus a setting row. Then you can use the arrow keys to move focus around the settings list. To edit a setting, you can press enter to set focus on the control in the setting row.
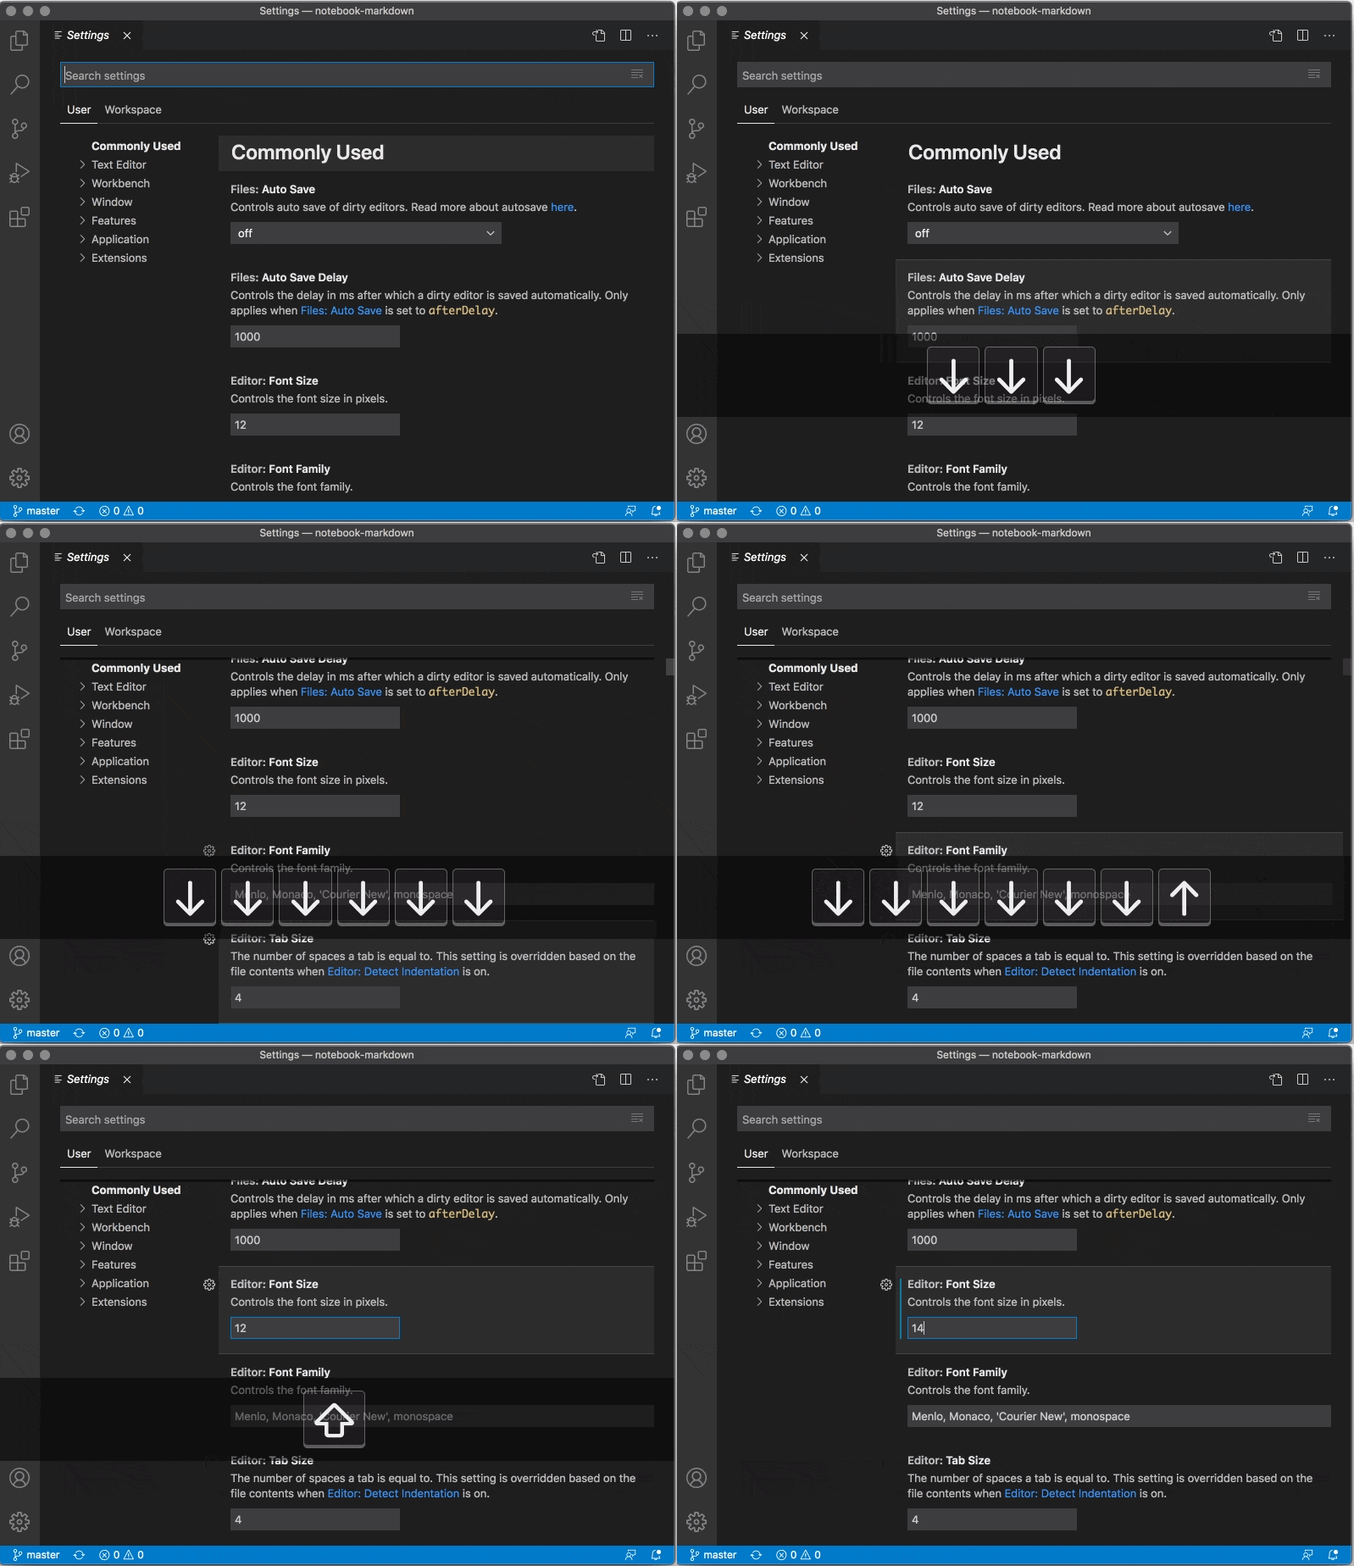
If you would like to read more about the motivation and thinking behind this approach, please see GitHub issue #108006.
Workbench
Pinned tabs improvements
Pinned tabs were introduced in our May 2020 release. Since then, we’ve received valuable feedback on how to improve this experience further, and for this milestone there are a couple of changes worth mentioning.
A new setting workbench.editor.pinnedTabSizing allows you to configure how large a pinned tab should appear:
normal: a pinned tab inherits the look of other tabs (new default)shrink: a pinned tab shrinks to a fixed size showing parts of the editor labelcompact: a pinned tab will only show as icon or first letter of the editor label
If you liked how pinned tabs looked prior to this release, make sure to configure "workbench.editor.pinnedTabSizing": "compact".
Pinned tabs also show a new “pinned” icon to allow you to unpin with one click. This icon will also appear in the “Open Editors” view.
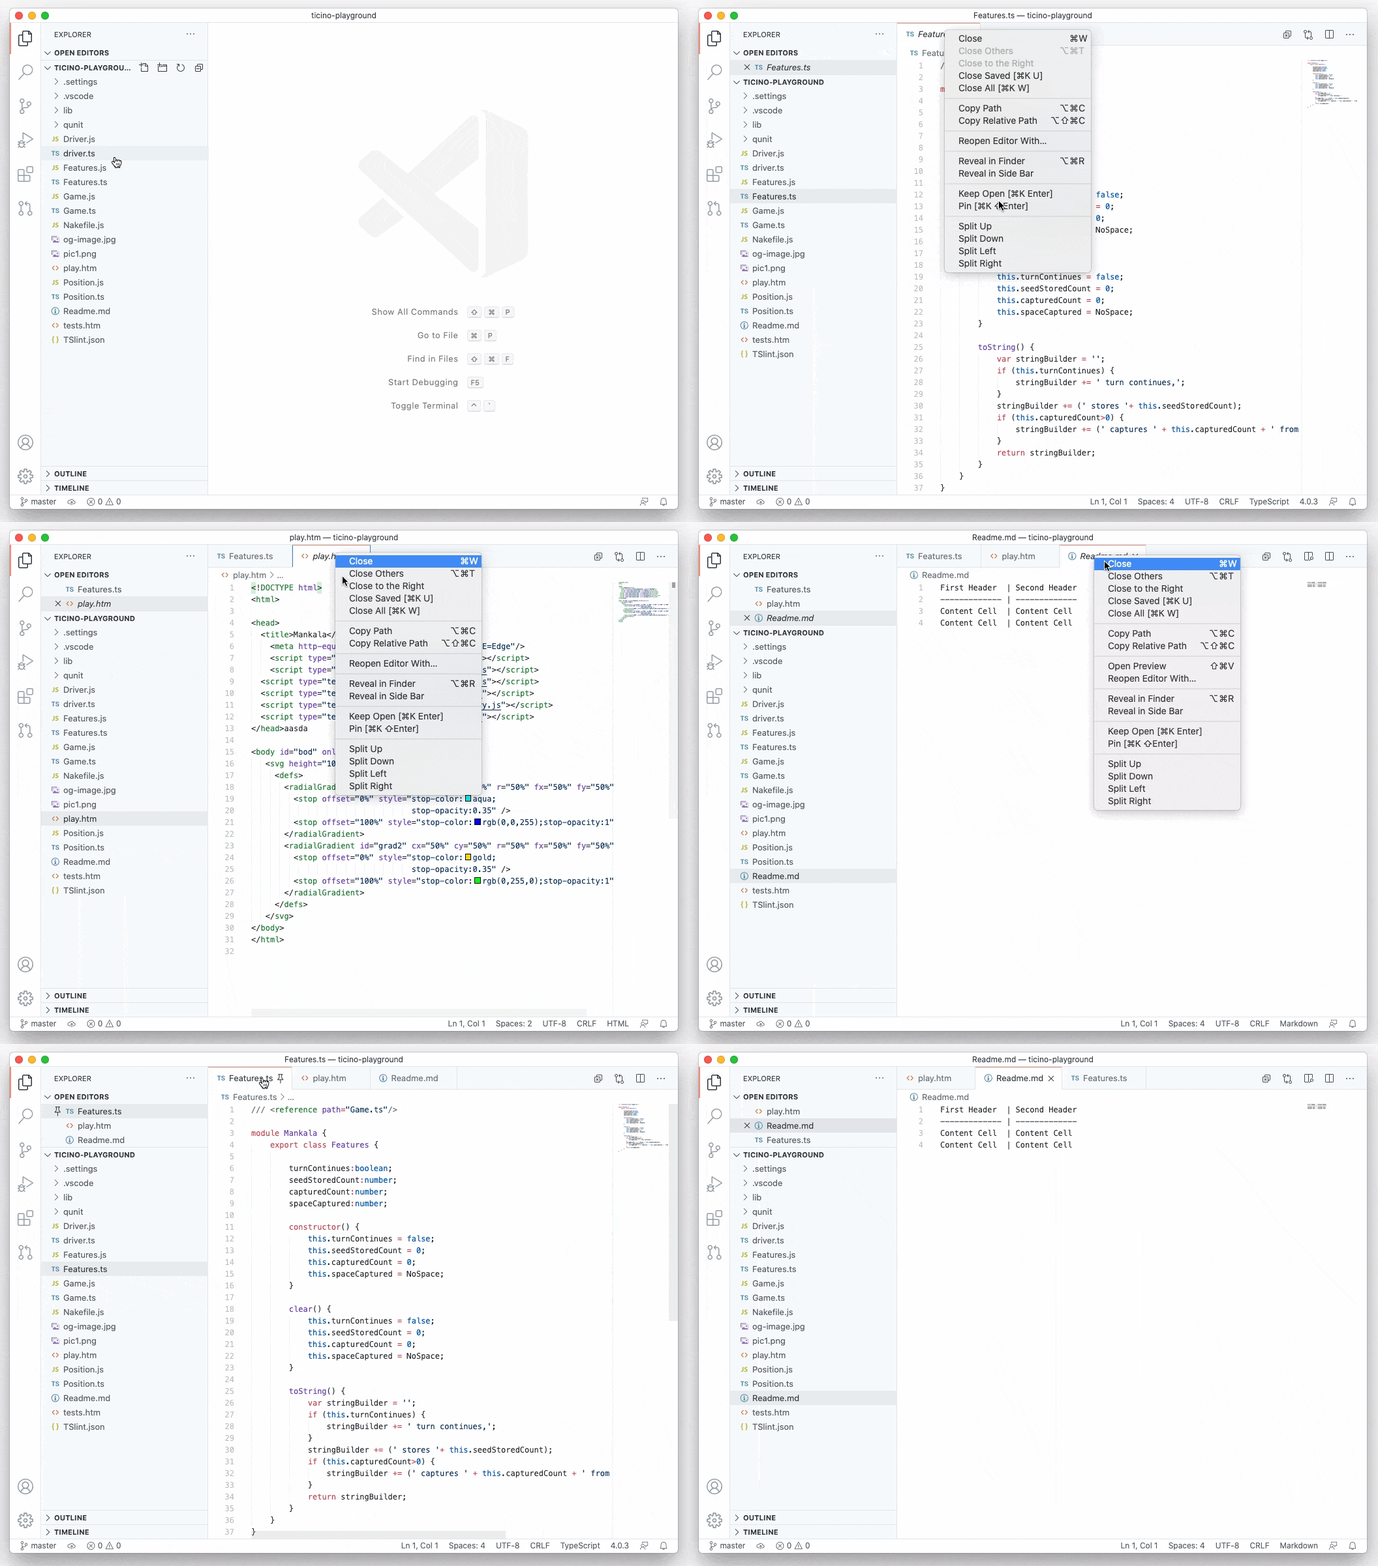
Theme: GitHub Light
Some other improvements include:
- Editors can now be pinned even when tabs are disabled.
Cmd+W(Ctrl+W) no longer closes a pinned editor, but selects the next non-pinned editor.- A new command workbench.action.closeActivePinnedEditor can be assigned to close a pinned editor.
- A new
tab.lastPinnedBordercolor can be assigned to draw a border to the right of the last pinned tab.
A few new editor context keys have been introduced, deprecating some of the existing ones. If you are using these in your keybinding settings, please update them:
groupActiveEditorDirtywas renamed toactiveEditorIsDirtyeditorPinnedwas renamed toactiveEditorIsNotPrevieweditorStickywas renamed toactiveEditorIsPinned
Two new context keys have been added for resources.
resourceDirnamefor the folder path of the resource, equivalent todirname(uri.fsPath)resourcePathfor the full path of the resource, equivalent touri.fsPath
Extensions: Simplified recommendation notifications
In this release, we improved the experience of recommending extensions using notifications by making them smarter and less noisy to users.
- Recommendations notifications are not shown again after you tried them or went through them.
- Only one recommendation notification is shown at any time in VS Code window. You can access already recommended notifications under the notification manager, the
bellicon in the status bar.
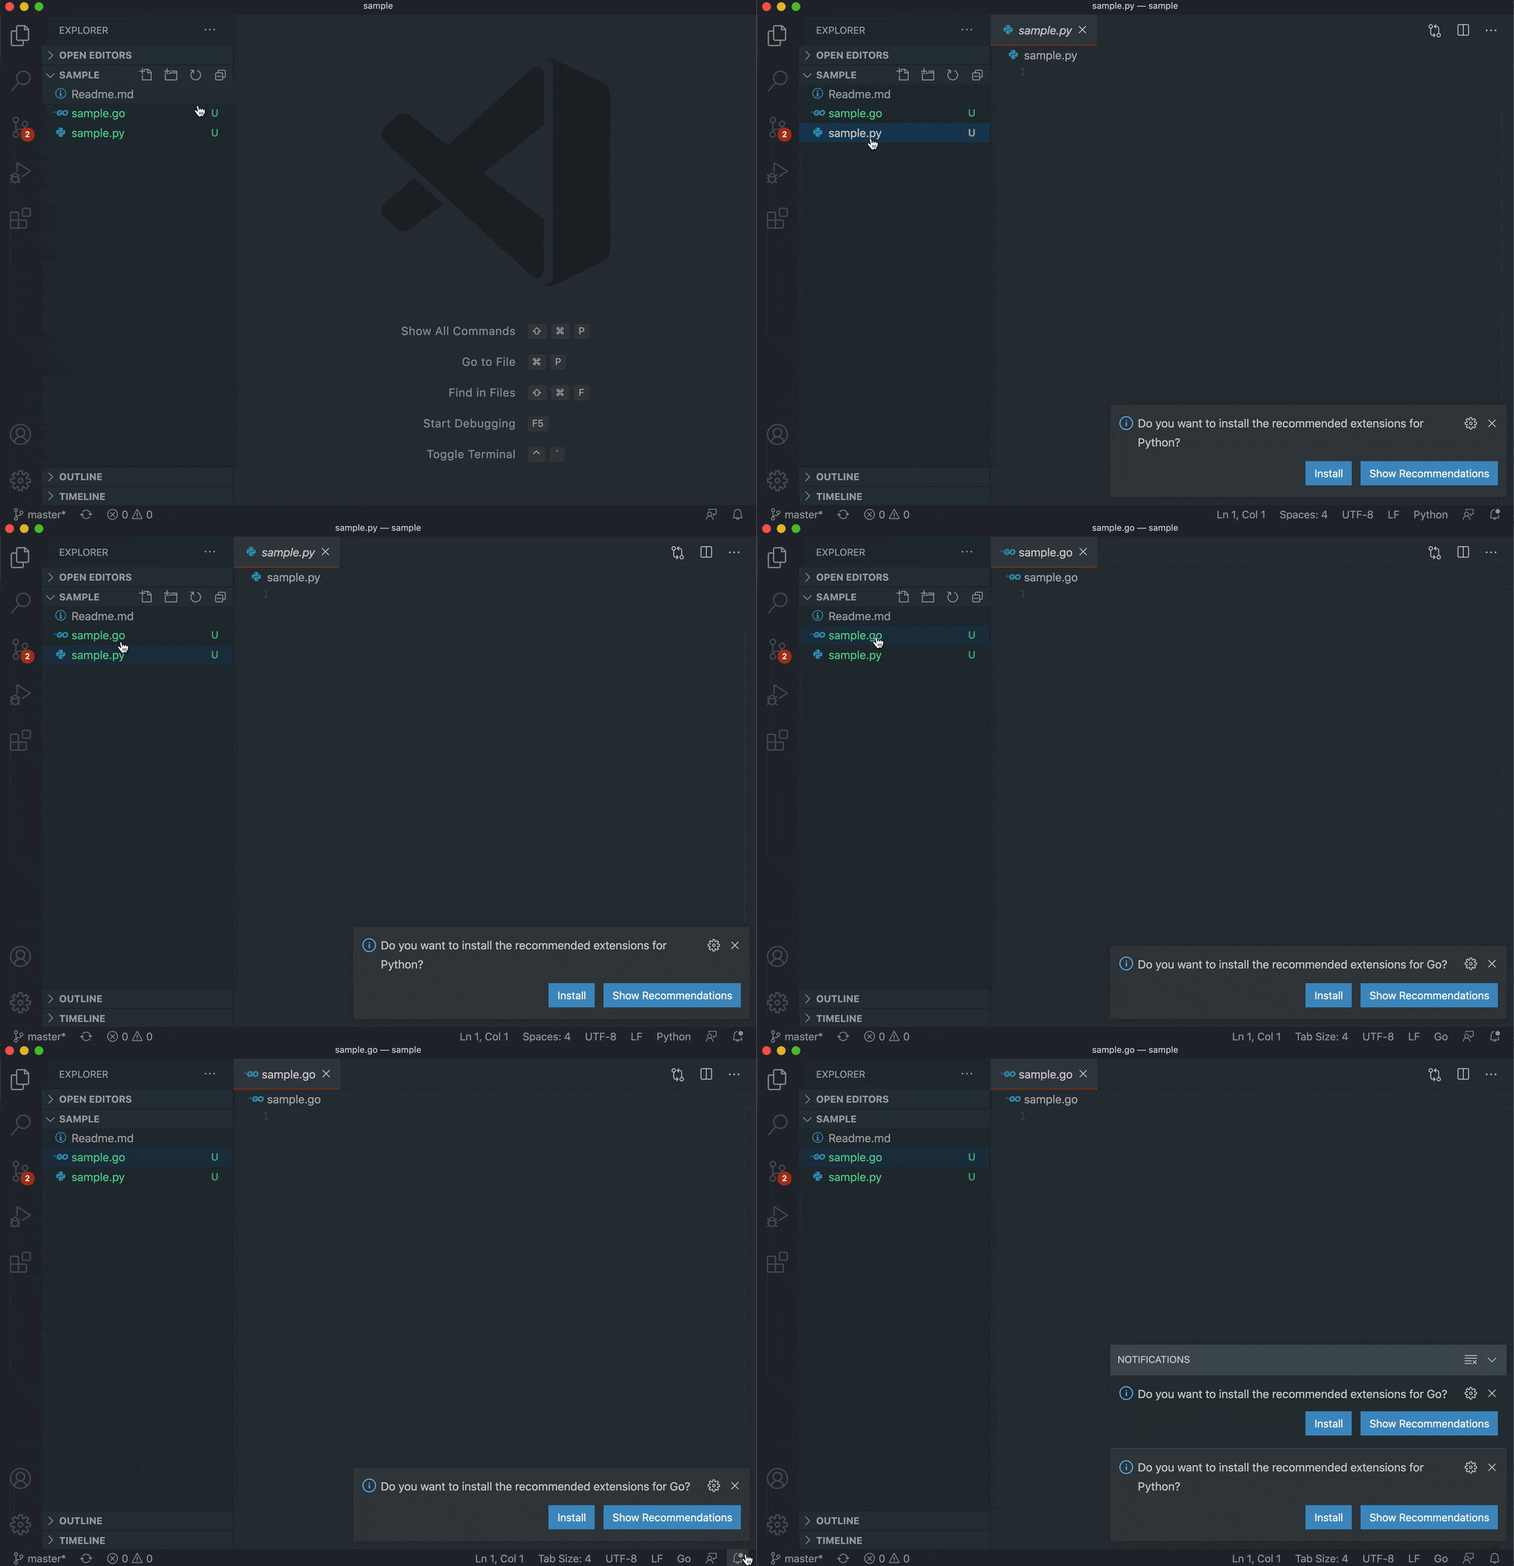
Theme: GitHub Sharp Dark
- Recommendation notifications supporting installations, like WSL, Docker etc., on your system, are made less noisy by showing only one such notification once per VS Code session – a session begins when you open VS Code and ends when you quit.
Panel layout improvements
New panel maximization setting
For those who prefer to work with the panel maximized, you no longer have to maximize the panel each time after toggling it open. For those that don’t, the old panel behavior isn’t going away.
Instead, a new setting, panel.opensMaximized, allows users to adjust to their own preference whether or not the panel always opens maximized when toggled with Toggle Panel. The options are always, never, and the default value preserve. The preserve option opens the panel maximized if it was maximized before being closed, and opens it non-maximized otherwise.
Additionally, if the panel is hidden, Toggle Maximized Panel will now always open the panel maximized.
Decreased minimum window width when panel is on the bottom
When the panel is on the bottom rather than on the side, the minimum window width is 400px instead of 600px. This way, developers who want a narrower editor-only or panel-only window can now move the panel to the bottom, optionally hide or maximize it, and then resize the window to the new narrower minimum width.
Linux ARM builds
VS Code is now available for both Linux ARMv7 and ARM64 architectures. This means you can now officially use VS Code on a Raspberry Pi, Chromebook, and other ARM-based devices!
On these devices, you can also leverage the VS Code extensions for Remote Development to get access to more powerful development environments when you need them.
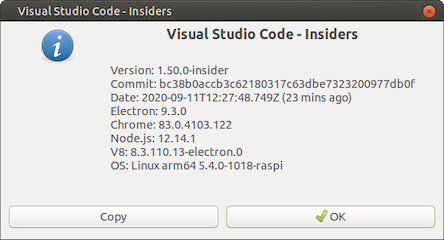
Download it now! Also available for Insiders.
Editor
Trigger IntelliSense
For years, Ctrl+Space has been the predominant keybinding to trigger IntelliSense. However, on macOS and Windows, the same keybinding is used to toggle between keyboard layouts. To minimize confusion, we added another keybinding to trigger IntelliSense: on Windows and Linux it’s Ctrl+I, and on macOS it’s Cmd+I.
Debugging
Debug hover improvements
-
Language hover now available while debugging
While debugging, the debug hover takes precedence over the language hover, making it impossible to see the language hover. Starting with this release, you can switch from the debug hover back to the language hover by holding down the
Altmodifier key. As long asAltis pressed, the language hover is shown instead of the debug hover. This makes it much easier to read Javadoc while debugging. -
Auto sizing debug hover
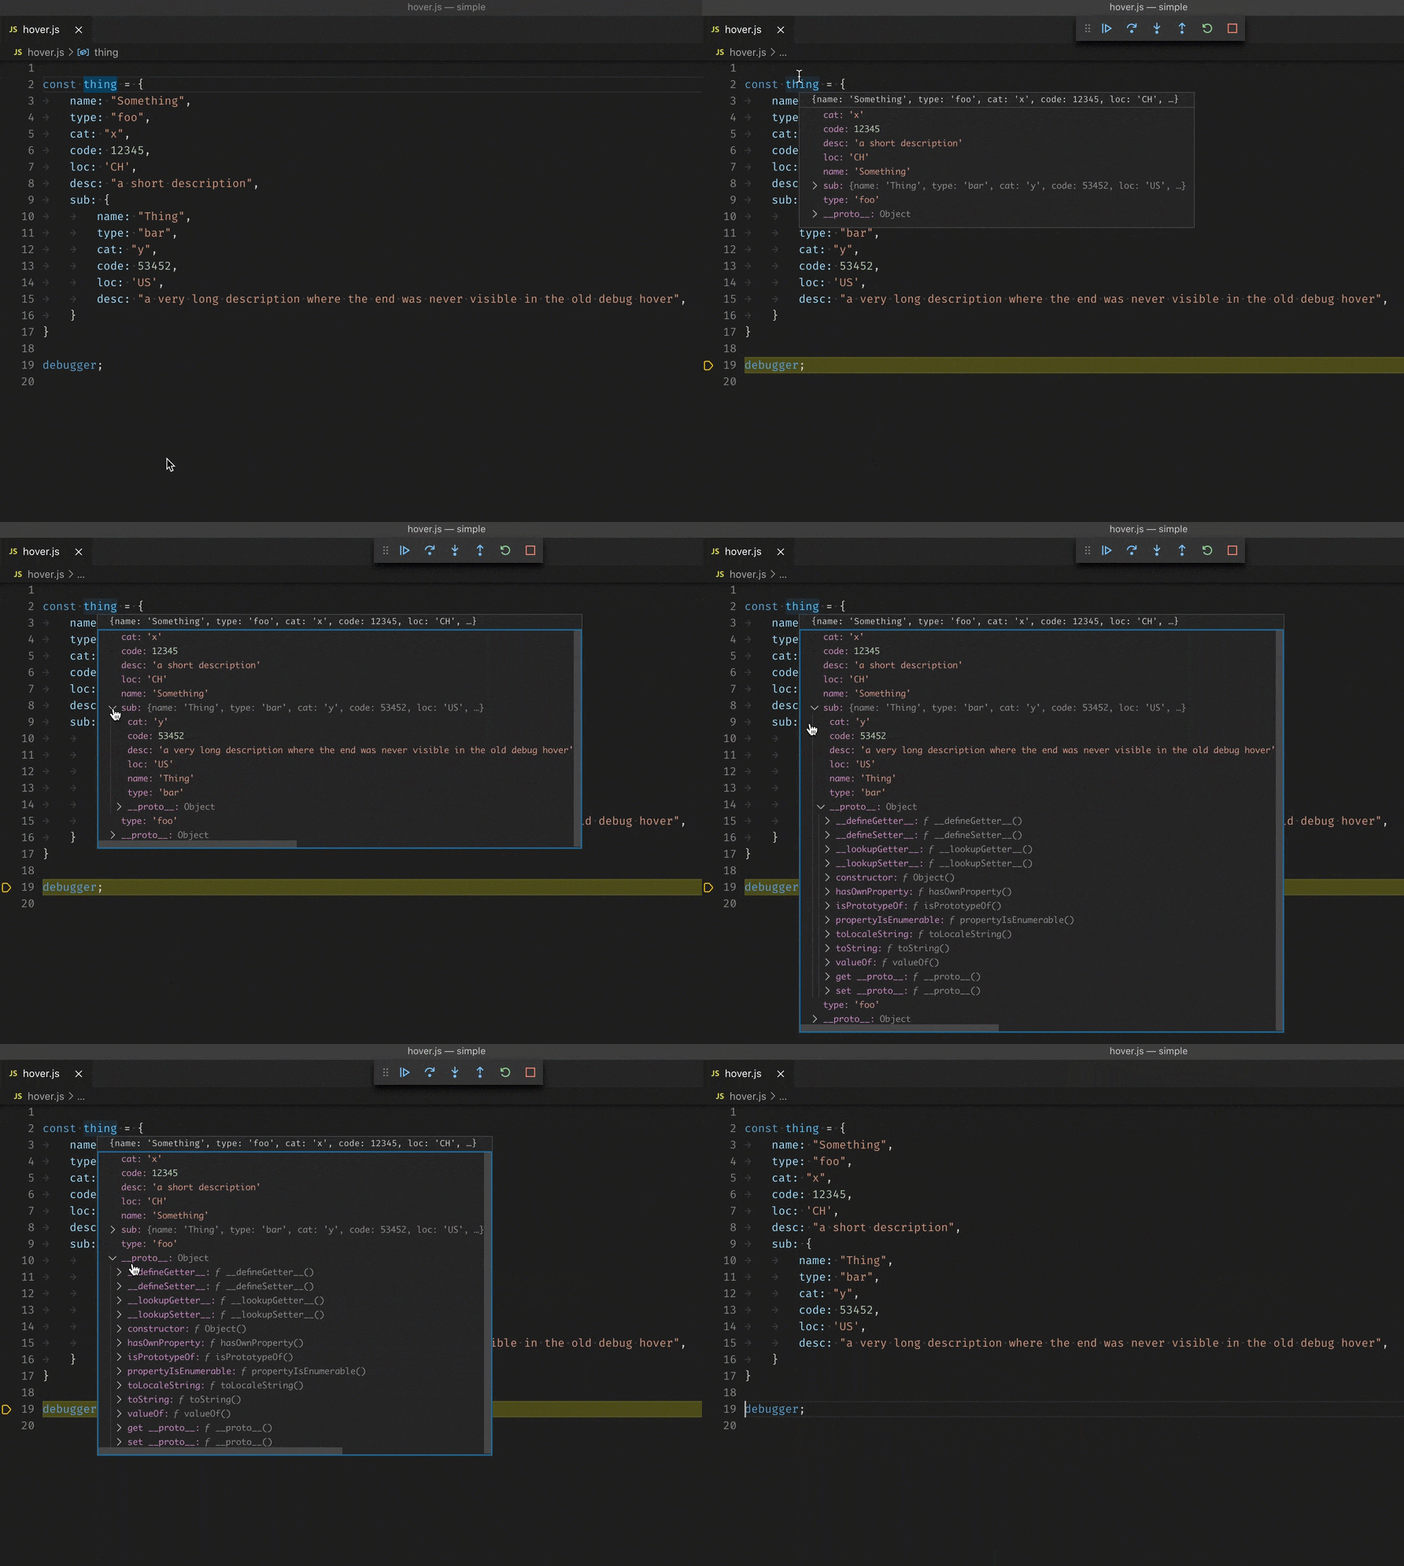
In order to minimize the need for scrolling, the debug hover width and height now automatically adapts to the size of the hover contents. This not only helps you the full strings, but you can also drill down into object structures, and the hover grows as needed.
Debug console filter improvements
The Debug Console now supports filtering, making it easier for users to find the output they are looking for, or to hide irrelevant logging output. We’ve added a badge to make it clear how many items are filtered away.

JavaScript debugging
Consolidated auto attach flows
Last month, we introduced new auto attach modes as an experimental feature. This month, they have left the experimental state. The previous debug.autoAttach setting is deprecated in favor of the debug.javascript.autoAttachFilter option. The auto attach badge in the status bar now shows the current mode and allows you to toggle between modes.
Real-time performance view
The flame chart extension will now show a real-time view of performance metrics while debugging JavaScript code. CPU and memory usage are shown for Node.js programs and extension debugging. Debugging Chrome or Edge will additionally show metrics for DOM nodes, relayouts, and restyles.
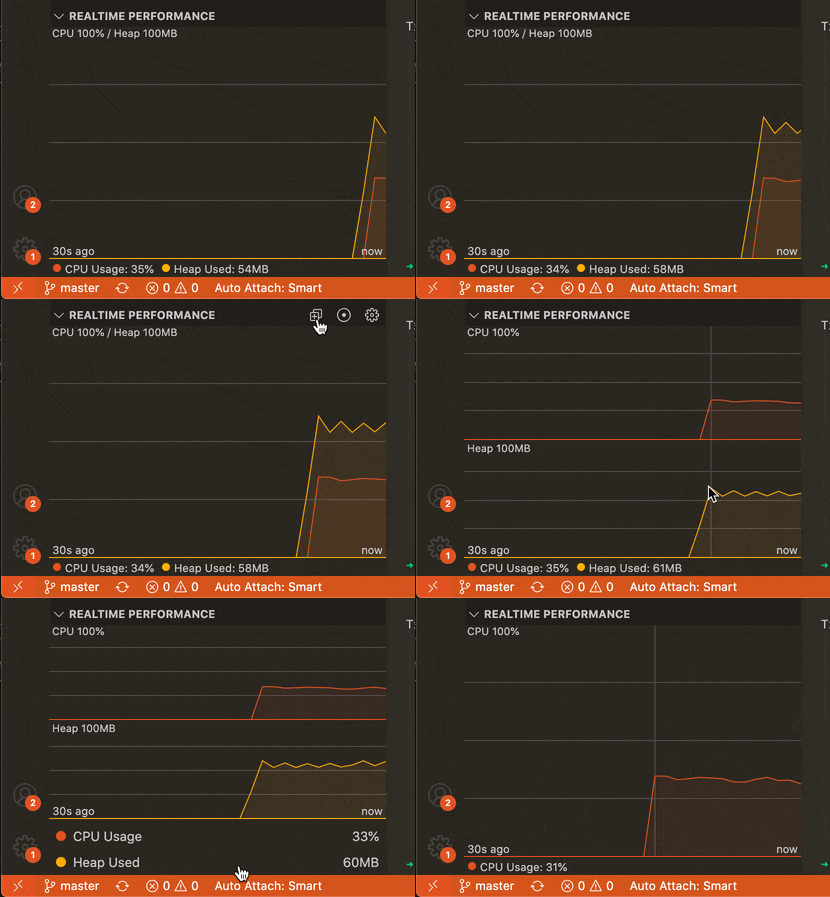
Theme: Codesong
In addition to the controls in the view, there are a few settings you can use to control it:
- debug.flameGraph.realtimePollInterval: how often stats are updated
- debug.flameGraph.realtimeViewDuration: how much time should be displayed on the graph
- debug.flameGraph.realtimeEasing: whether easing is enabled
Left-heavy flame chart view
Also new in the flame chart extension is a “left heavy” view, toggled by clicking the button in the upper-right corner of the chart.
This view groups call stacks and orders them by time, creating a visual representation of the “top down” table you might have used in other tools. This is especially useful if your profile has lots of thin call stacks (common with things like web servers) which are hard to get a sense of in the chronological view.
Here we have the same profile opened in the traditional chronological view on the right, and the left-heavy view on the left. With the left-heavy view, it’s much easier to tell exactly where time is being spent.

Theme: Codesong
Step through missing code
Previously if you tried to debug a file that has a sourcemap, but for which the source was not available, you would get stuck on a “could not load source” error and would be unable to view the compiled code. We now show a prompt allowing you to ignore the sourcemap and step through compiled code in these cases.

Theme: Codesong
Source Control
Git: Commit –no-verify commands
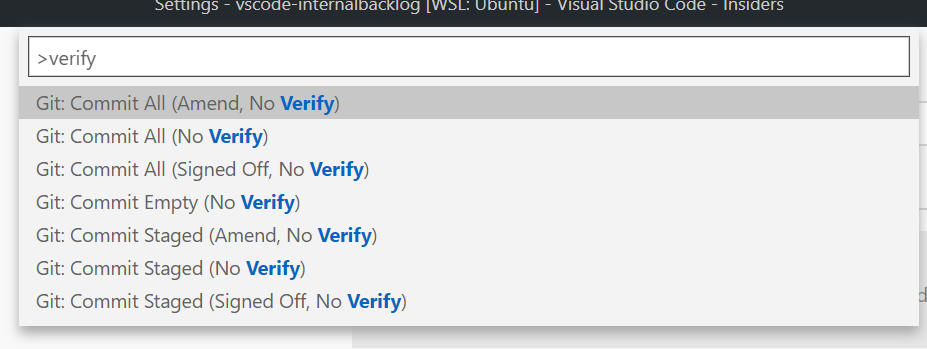
Git commit commands with the --no-verify flag are now available after enabling the git.allowNoVerifyCommit setting.
Git: Multiple git.path values
You can now specify a list of locations to look for the git executable via the same git.path setting, by using an array of strings.
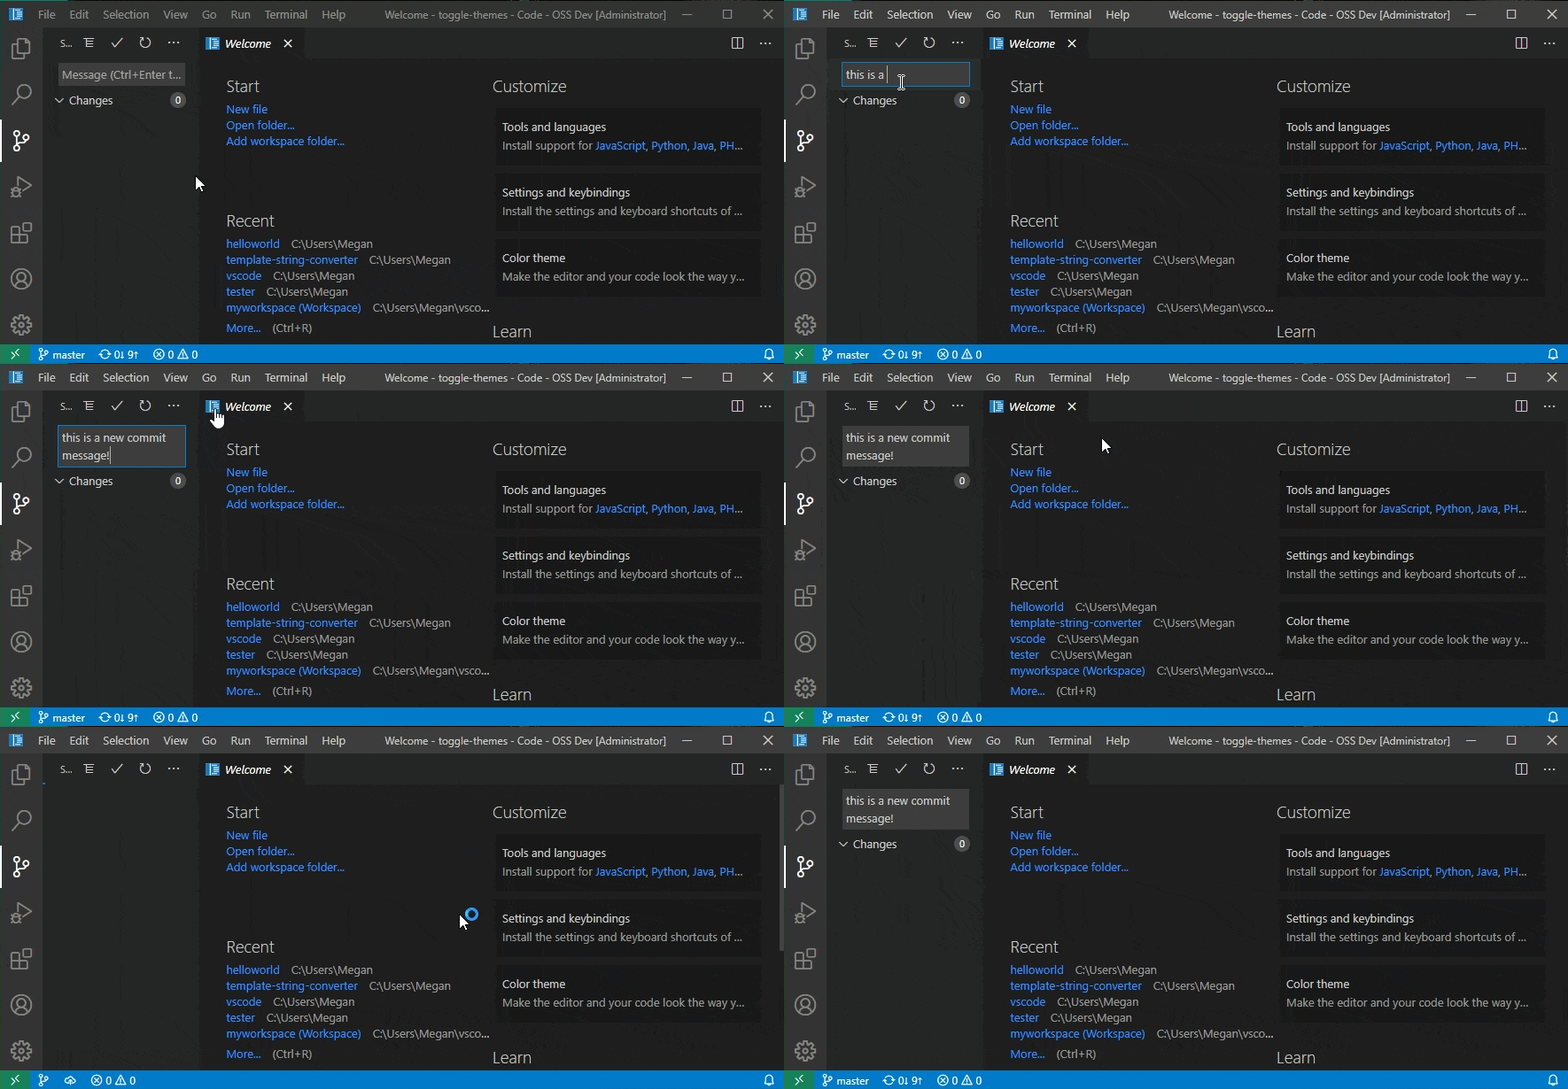
Source Control view saves input on window reload
Addresses this request to save the Source Control view input on window reload.
Terminal
Search the workspace by selecting text in the terminal
The standard shortcut for searching the workspace ⇧⌘F (Windows, Linux Ctrl+Shift+F) will now use the terminal’s selection if it’s focused.
Preview features
Preview features are not ready for release but are functional enough to use. We welcome your early feedback while they are under development.
Settings sync
You can now select which settings sync service to use (insiders or stable) while turning on Settings Sync. Note: This option is only available on Insiders.
TypeScript 4.1 beta support
VS Code supports the TypeScript 4.1 beta and nightly builds. The 4.1 update brings some new TypeScript language features, such as support for recursive conditional types, as well as tooling improvements. One focus area has been adding initial support for @see tags in JSDoc comments.
To start using the TypeScript 4.1 nightly builds, just install the TypeScript Nightly extension. Please share feedback and let us know if you run into any bugs with TypeScript 4.1.
Contributions to extensions
GitHub Pull Requests and Issues
Work continues on the GitHub Pull Requests and Issues extension, which allows you to work on, create, and manage pull requests and issues.
To learn about all the new features and updates, you can see the full changelog for the 0.21.0 release of the extension.
Remote Development
Work continues on the Remote Development extensions, which allow you to use a container, remote machine, or the Windows Subsystem for Linux (WSL) as a full-featured development environment.
Feature highlights in 1.50 include:
- Improved log access and rendering for containers.
- Better recovery support for cloning repositories in container volumes.
- Ability to install an extension in a remote context (container, SSH, WSL) without having to reload VS Code.
You can learn about new extension features and bug fixes in the Remote Development release notes.
ESLint
The approval flow to allow the execution of a ESLint library got reworked. The initial experience is now as follows:
- No modal dialog is shown when the ESLint extension tries to load a ESLint library for the first time and an approval is necessary. Instead, the ESLint status bar item changes to

- If the active text editor content can be validated using ESLint, a problem at the top of the file is shown in addition.
The execution of the ESLint library can be denied or approved using the following gestures:
- Clicking on the Status Bar icon.
- Using the quick fix for the corresponding ESLint problem.
- Executing the command ESLint: Manage Library Execution from the command palette.
All gestures will open the following dialog:
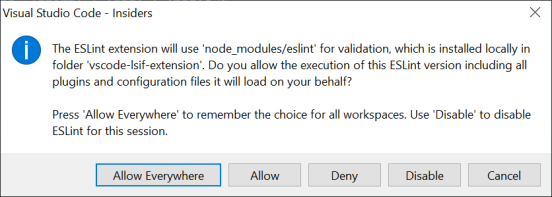
The chosen action is then reflected in the ESLint Status Bar item in the following way:
Allowwill prefix the status bar item with a check mark.Allow Everywherewill prefix the status bar item with a double check mark.DenyandDisablewill prefix the status bar item with a blocked sign.
You can manage our decisions using the following commands:
- ESLint: Manage Library Execution will reopen above dialog.
- ESLint: Reset Library Decisions lets you reset previous decisions you have made.
Template string converter
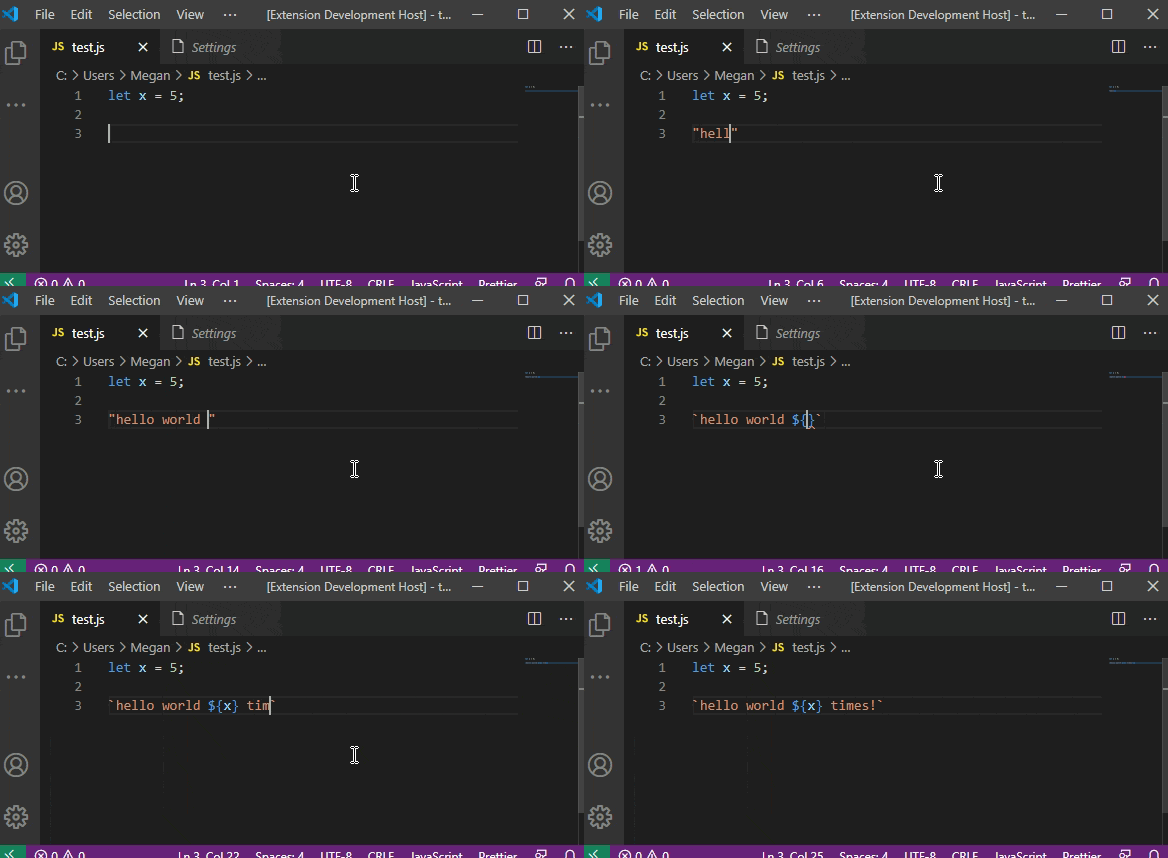
The Template String Converter extension converts quotes to backticks when a $ and { are entered within a string in JavaScript and TypeScript files.
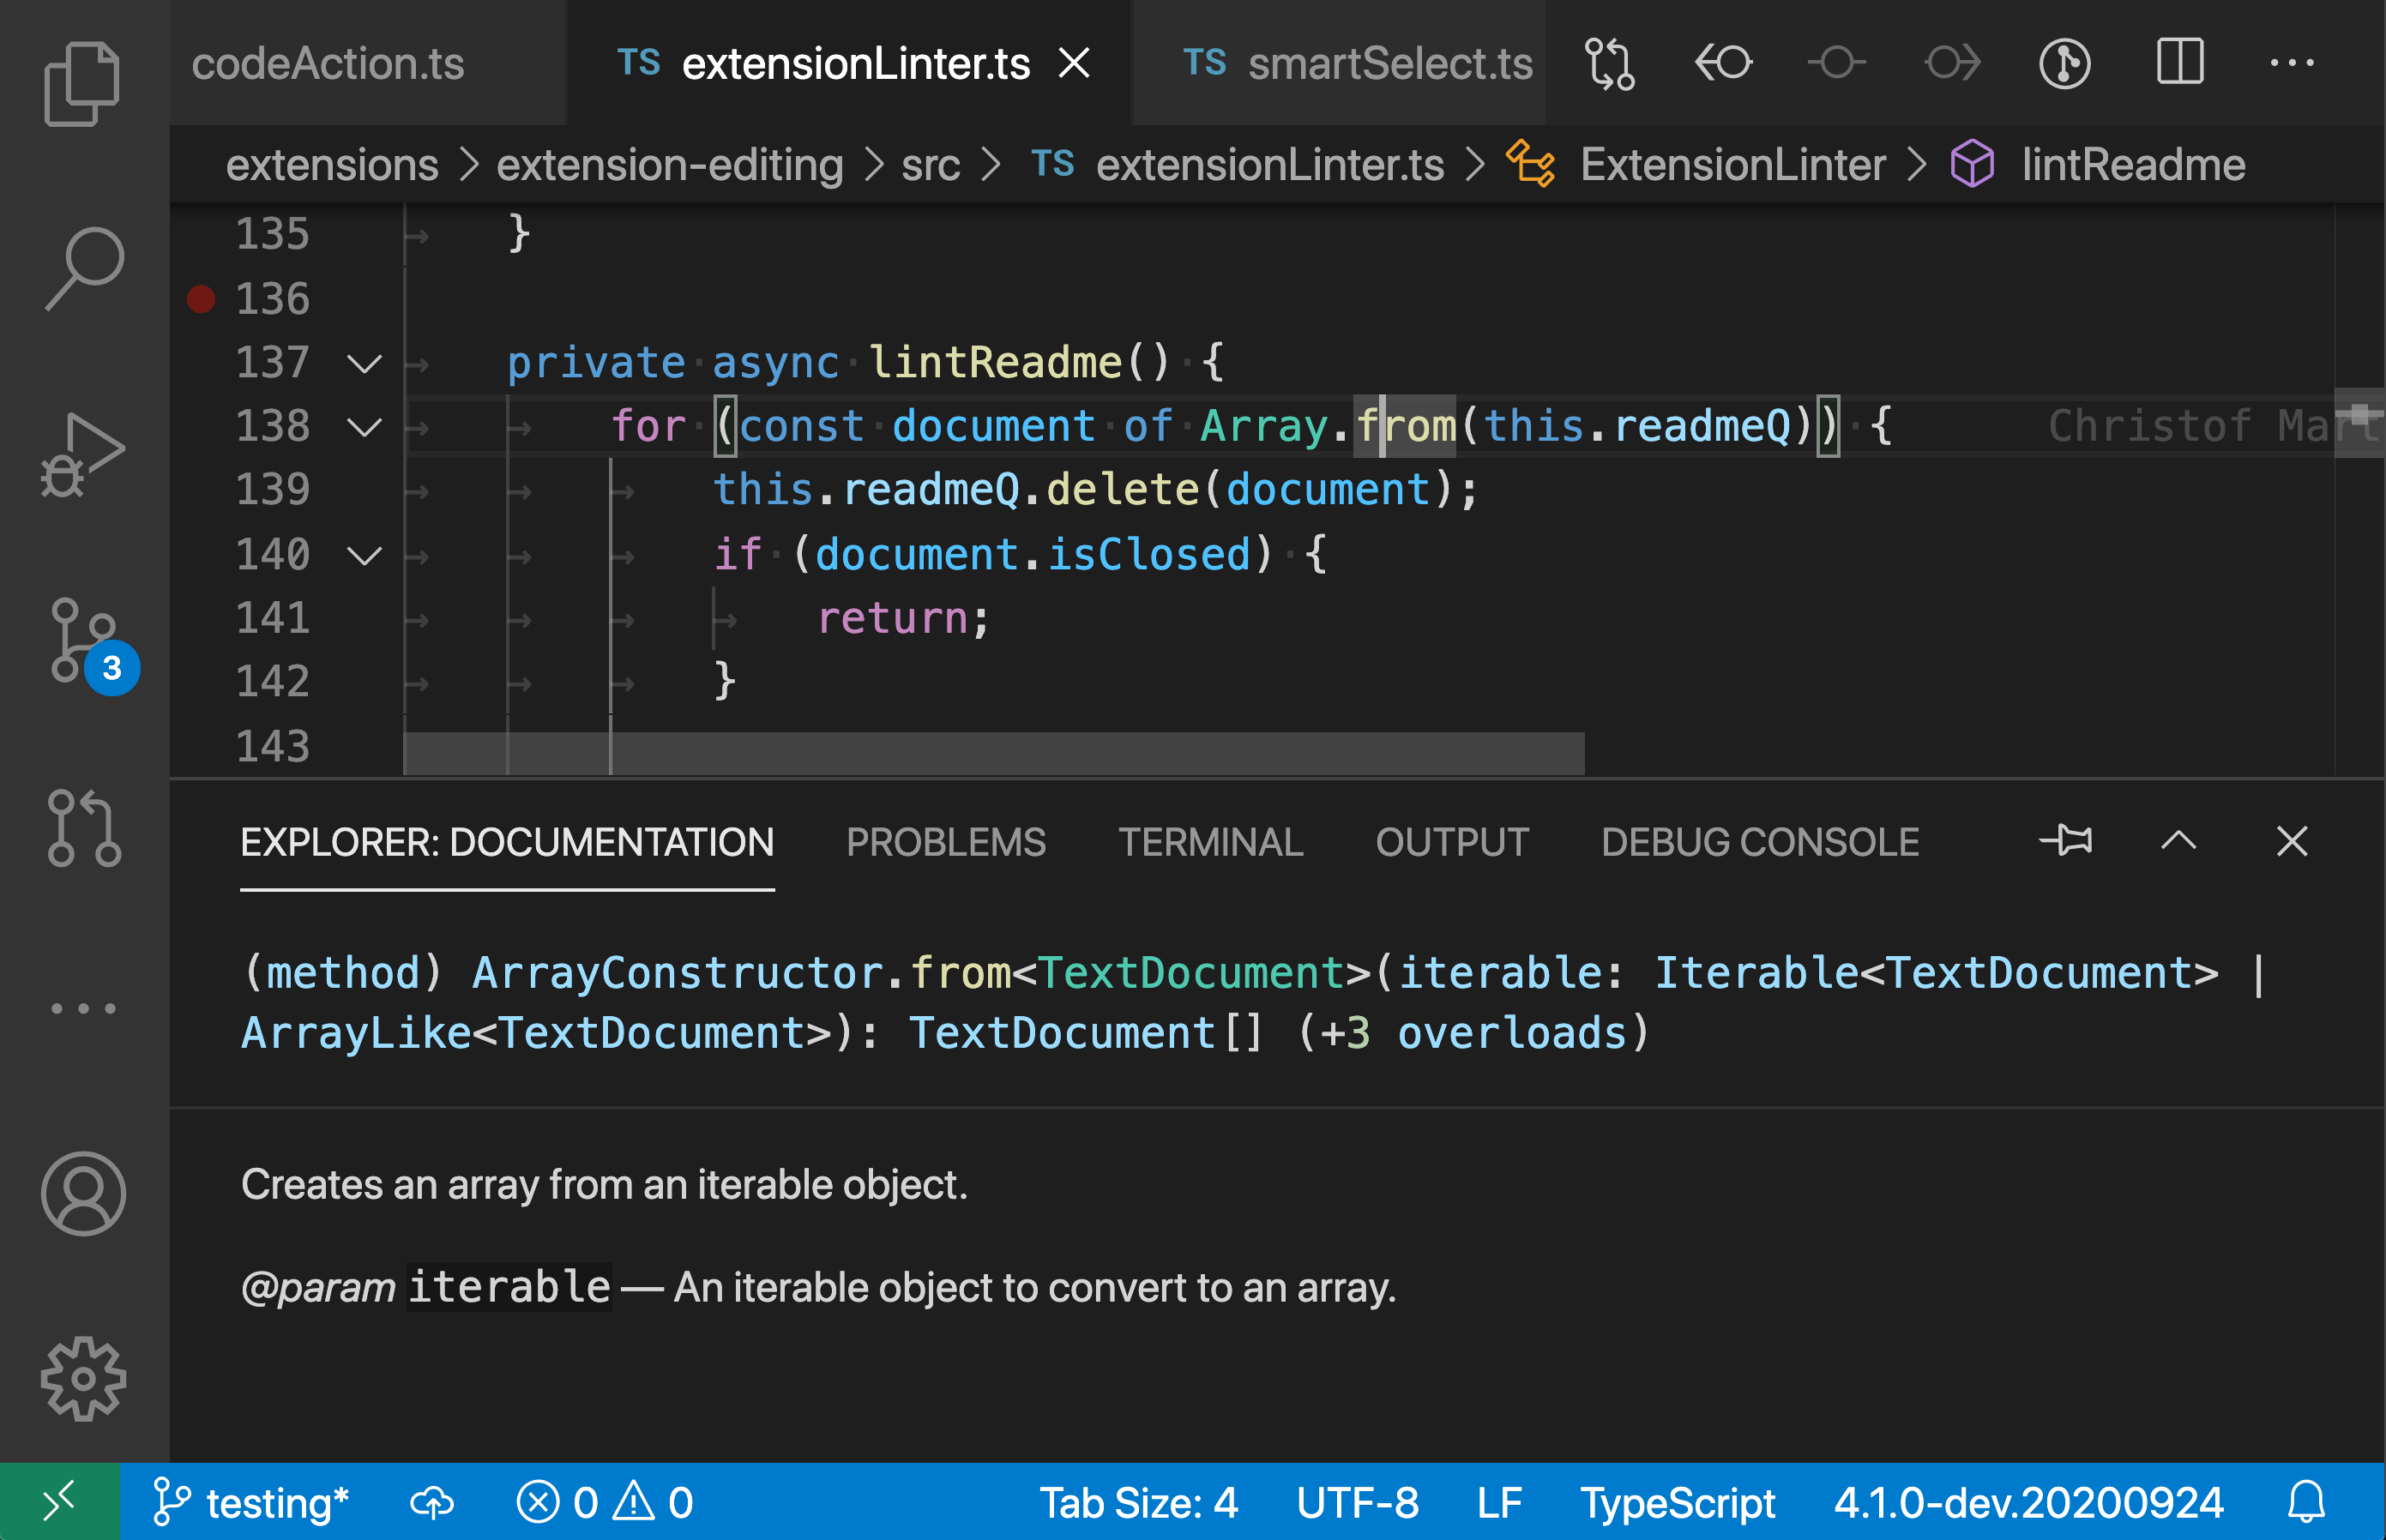
Docs View
The Docs View extension uses the new Webview View API to show documentation for the symbol at the current cursor position in the sidebar or panel:
The submenu API has been promoted out of proposed state. Extension authors can now define and use submenus across supported menu locations. Check out the syntax as well as the possibilities that this API enables.
Source Control Resource State context value
Instances of SourceControlResourceState now support an optional contextValue: string field, which allows defining a context value to match again when clauses in the scm/resourceState/context menu. The context key to use is scmResourceState. More details on the original feature request and respective pull request.
Asynchronously resolve code action
For code action providers, we have added an optional function (CodeActionProvider#resolveCodeAction) which allows you to defer the computation of the actual edits a code action is going to make. This should help reduce the time it takes to provide code actions.
References Viewlet API
The references viewlet now exports an API that allows its content to be defined by other extensions.
New theme colors
tab.lastPinnedBorder: Border on the right of the last pinned editor to separate from unpinned editors.gitDecoration.stageDeletedResourceForeground: Foreground color for staged deletions git decorations.gitDecoration.stageModifiedResourceForeground: Foreground color for staged modifications git decorations.charts.red,charts.blue,charts.yellow,charts.orange,charts.green,charts.purple,charts.foreground,charts.lines: Colors intended to be used by data visualization extensions.
Webview Views
The Webview View API allows extensions to contribute webview based views to the sidebar or panel. These views can offer specialized presentations of data, more advanced user interfaces, and much more.
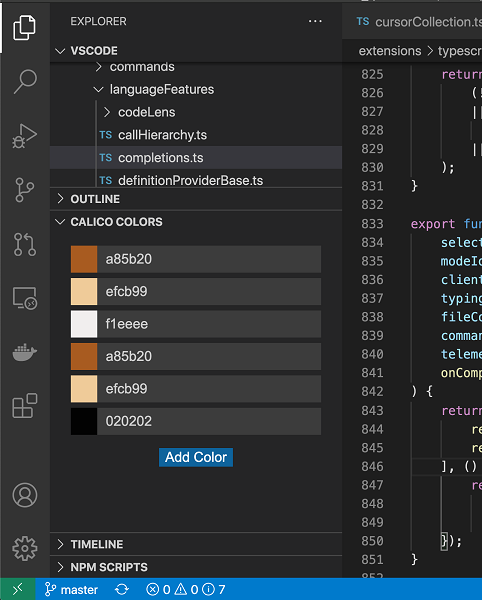
To get started with webview views, take a look at the webview view extension sample.
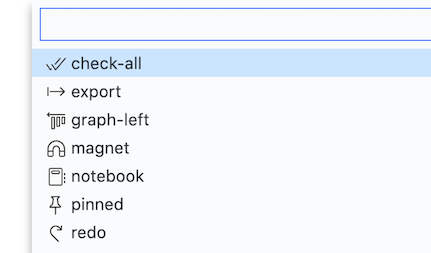
Updated Codicons
We’ve added the following new icons to our codicon library:
exportgraph-leftmagnetnotebookredocheck-allpinned
View title description
The TreeView now has an optional description property which can be used to show less prominent text next to a tree’s title.

Proposed extension APIs
Every milestone comes with new proposed APIs and extension authors can try them out. As always, we want your feedback. This is what you have to do to try out a proposed API:
- You must use Insiders because proposed APIs change frequently.
- You must have this line in the
package.jsonfile of your extension:"enableProposedApi": true. - Copy the latest version of the vscode.proposed.d.ts file into your project’s source location.
You cannot publish an extension that uses a proposed API. There may be breaking changes in the next release and we never want to break existing extensions.
Notebook API
The following new and changed APIs are part of the notebooks API proposal:
NotebookCell#index– A notebook cell belongs to a notebook document and this new property indicates at which position in the notebook document a cell sits. This property changes when a cell is moved.TextDocument#notebook– A property of a text document, which signals that it is part of a notebook, as a notebook cell document. This property isundefinedfor ordinary documents.- Strict Editing – Notebook documents can only be modified via declarative edits that are either part of a
WorkspaceEditand submitted viaNotebookEditor#edit. This ensures data consistency between extension hosts and the UI.
We have added a new property readOnly to CommentThread to allow hiding the reply button in a comment thread.
Debug Adapter Protocol
New invalidated event
A new invalidated event has been added to the protocol. This event signals that some state in the debug adapter has changed and requires that the client (frontend) needs to re-render the data previously requested.
Debug adapters do not have to emit the event for runtime changes like “stopped” or thread changes because in these cases the client refetches the new state anyway. However, the event can be used to refresh the UI after rendering formatting has changed in the debug adapter. Debug adapters should only send the event if a true supportsInvalidatedEvent capability was received from the client in the ‘initialize’ request. Mock debug has an example for how to use the event.
Proposal for Conditional Exception support
We are planning to support “Conditional Exceptions” in a future version of VS Code. Since this requires support in the Debug Adapter Protocol (DAP) we’ve prepared a proposal for “Conditional Exception” support. If you are a debug extension author and interested in this DAP protocol addition, we’d appreciate your feedback.
Engineering
Building VS Code with TypeScript 4.1 beta
We now use the TypeScript 4.1 nightly builds to build VS Code. TypeScript 4.1 adds a few new strictness checks, including more strict types for resolve in promises. This improved type checking helped us to identify and fix potential bugs in our code.
Documentation
Updated Create a Dev Container tutorial
We’ve updated the documentation to help you create a development container. The tutorial now clearly walks you through the steps to create a reusable Docker container to match your development environment. You’ll learn how to:
- Author a
devcontainer.jsonto describe how VS Code will create and start your container. - Add additional software and frameworks through a
Dockerfile. - Combine multiple Docker containers through Docker Compose.
- Build and test your custom development container.
Notable fixes
- 96293: Run menu does not remember dynamic launch configurations
- 100924: Debug & variable inspector break if filename case in editor differs to project explorer
- 106727: If I switch workspace, focus moves to different VS Code instance
- 103185: Dropdown base font-size increased from Electron 9 update
- 101952: Trigger “Save As…” for virtual document editors when saving
- 106668: Bash for Windows terminals wrapping over 80 characters, terminals aren’t sized correctly
Partner extensions
Microsoft C++ extension
The Microsoft C/C++ extension is now out of preview and version 1.0 has lots of great features:
- Support for Linux on ARM and ARM 64 – complete with IntelliSense and remote build and debug support.
- Code formatting – Use the same formatting settings as Visual Studio IDE, along with EditorConfig properties.
And check out this video tutorial for configuring C++ IntelliSense in VS Code.

Microsoft Edge Tools extension
The Microsoft Edge Tools for VS Code extension is out of preview and provides the Microsoft Edge dev tools directly in VS Code. You will be able to see your site’s runtime HTML structure, alter its layout, fix styling issues as well as see your site’s network requests.

You can read more about this release and the extension’s powerful features in this recent blog post.
Azure Cognitive Search extension
Try out the new Microsoft Azure Cognitive Search extension for working with Azure Cognitive Search. The extension makes it easy to develop and manage your search service directly from VS Code and includes full IntelliSense and a rich set of snippets.

Thank you
Last but certainly not least, a big Thank You to the following people who contributed this month to VS Code:
Contributions to our issue tracking:
Contributions to vscode:
Contributions to vscode-references-view:
Contributions to vscode-vsce:
Contributions to vscode-json-languageservice:
Contributions to vscode-css-languageservice:
Contributions to node-jsonc-parser:
Contributions to vscode-js-debug:
Contributions to vscode-codicons:


